This webpage focuses on using Natural Language Processing (NLP) techniques to dive into the world of Reddit and uncover insights related to interview subreddits. Main accomplishments include identifying and analyzing the significant themes and sentiments within the data. By using NLP techniques, the commonly discussed topics were supported and extracted, providing a clear understanding of the dominant conversations surrounding technical interview attributes. In addition, external data elevated the ability to extract financial insights related to certain types of companies seeking job applicants. These efforts were important in aligning with the business strategies for the target audience (job seekers and students).
Furthermore, sentiment analysis was employed to provide a perspective on the tone of the Reddit discussions. This aspect of the project was particularly enlightening as it revealed the mood and attitudes of subreddit participants towards certain interview aspects. These insights are significantly valuable for helping students in prepare for technical interviews by highlighting common concerns and the overall mood surrounding the interview process. The integration of NLP, in bridging data and decision making showcases how technology can elevate business intelligence and enhance student engagement.
This data set was combined by the author of the GitHub repository above from two sources: LEVELS.FYI API and a Kaggle dataset on data science and stem salaries (see README in repository linked above). The original data set contains yearly compensation (total, base salary, bonuses, and stock grants), location, years of experience, and years at the company information for STEM and data science roles within over 1500 companies. This data ranges from 2017 to 2021.
For the project’s purposes, the cleaned data set averages yearly compensation, base salary, bonus, years of experience, and years at company for each company and role type (tech or non-tech). The role type column was created by classifying roles as either “tech” or “non tech”. For example, a software engineer would be classified as “tech”; meanwhile, sales is classified as “non tech”. From there, the data was subset to include just the tech role information. Additionally, the ability to focus on tech vs. non-tech roles was achieved through filtering. Below is the code used to initially clean the external data set along with a table showing the first 20 rows.
Code
# Import librariesimport osimport openpyxlimport pandas as pdimport numpy as np# Read in the datacompany_names = pd.read_csv("../data/external_data/company_name_matching_RAW.csv")salaries = pd.read_excel("../data/external_data/levels_fyi_salary_data_RAW.xlsx", sheet_name ="data")# Subset columnssalaries_subset = salaries[["timestamp", "company", "title", "totalyearlycompensation", "location", "yearsofexperience", "yearsatcompany", "basesalary", "stockgrantvalue", "bonus"]]# Add a year column and drop timestamp columnsalaries_subset["year"] = pd.to_datetime(salaries_subset["timestamp"]).dt.yearsalaries_subset = salaries_subset.drop(["timestamp"], axis =1)# Change data typesdata_types = {"company": str, "title": str, "totalyearlycompensation": float, "location": str, "yearsofexperience": float, "yearsatcompany": float, "basesalary": float, "stockgrantvalue": float, "bonus": float, "year": int}salaries_subset = salaries_subset.astype(data_types)salaries_subset["year"] = pd.to_datetime(salaries_subset["year"], format="%Y")# Create clean company name matchingcompany_mapping =dict(zip(company_names["Variant"].str.strip(), company_names["Clean Company"]))# Make a new column with the clean company namessalaries_subset = salaries_subset.rename(columns = {"company": "old_company"})salaries_subset["company"] = salaries_subset["old_company"].map(company_mapping)salaries_subset = salaries_subset.drop(["old_company"], axis =1)# Categorize available titles as "tech" or "non tech"role_type_dict = {'Product Manager': 'tech', 'Software Engineer': 'tech','Software Engineering Manager': 'tech', 'Data Scientist': 'tech','Solution Architect': 'tech', 'Technical Program Manager': 'tech','Human Resources': 'non tech', 'Product Designer': 'tech', 'Marketing': 'non tech','Business Analyst': 'tech', 'Hardware Engineer': 'tech', 'Sales': 'non tech', 'Recruiter': 'non tech', 'Mechanical Engineer': 'tech', 'Management Consultant': 'non tech'}salaries_subset["role_type"] = salaries_subset["title"].map(role_type_dict)# Rearrange columnssalaries_subset = salaries_subset[["company", "year", "role_type", "title", "totalyearlycompensation", "location", "yearsofexperience","yearsatcompany", "basesalary", "stockgrantvalue", "bonus"]]# Get a summary table of averages by company and role typesummary_df = salaries_subset.groupby(["company", "role_type"]).agg({"totalyearlycompensation": "mean", "yearsofexperience": "mean","yearsatcompany": "mean", "basesalary": "mean","stockgrantvalue": "mean", "bonus": "mean"}).reset_index()summary_df.columns = ["company", "role_type", "average_yearly_compensation", "average_years_experience", "average_years_at_company", "average_base_salary", "average_stock_grant_value", "average_bonus"]# Subset for just FAANG (Facebook, Amazon, Apple, Netflix, Google)# faang_df = summary_df[(summary_df["company"] == "Facebook") | (summary_df["company"] == "Amazon") | (summary_df["company"] == "Apple") | (summary_df["company"] == "Netflix") | (summary_df["company"] == "Google")]summary_df.head(10)
company
role type
average yearly compensation
average years experience
average years at company
average base salary
average stock grant value
average bonus
10x Genomics
Tech
193333.333333
3.166667
0.666667
149666.666667
27666.666667
15166.666667
23andMe
Non Tech
160000.000000
10.000000
4.000000
160000.000000
0.000000
0.000000
23andMe
Tech
152333.333333
2.000000
0.333333
109166.666667
19833.333333
0.000000
The plots below depict the distribution of the six numeric variables in the external data set: average yearly compensation, average base salary, average years spent at the company, average years of experience, average stock grant value, and average bonus. From this point forward, the only focus will be on “tech” roles; hence, the figures below depict the distributions for each metric for the tech roles only.
In the EDA portion, the data set was tagged based on whether or not a FAANG company was mentioned. FAANG includes Facebook, Apple, Amazon, Netflix, and Google. To take it further, all of the companies present in the external data set were searched for and tagged accordingly. Then, the two data sets were merged based on the company mentioned in each row. This did not apply to cases when multiple companies are mentioned in a post or comment or when no companies were mentioned (Null). Below is the code used to tag the data set with more companies and merge with the external data set.
Preparing the Reddit Data for Merging
Code
# Import packagesimport timeimport sagemakerimport numpy as npimport pandas as pdimport pyarrow as paimport pyarrow.dataset as dsimport matplotlib.pyplot as pltimport pyspark.sql.functions as Fimport pandas as pdimport datetimefrom pyspark.sql import SparkSessionfrom s3fs import S3FileSystemfrom sagemaker.spark.processing import PySparkProcessorfrom pyspark.sql.functions import concat, lit, lower, col, when, array, expr, count, isnan, length, udffrom pyspark.sql.types import ArrayType, StringType# Build Spark sessionspark = ( SparkSession.builder.appName("PySparkApp") .config("spark.jars.packages", "org.apache.hadoop:hadoop-aws:3.2.2") .config("fs.s3a.aws.credentials.provider","com.amazonaws.auth.ContainerCredentialsProvider", ) .getOrCreate())print(spark.version)# Read in the filtered submissions%%timesession = sagemaker.Session()bucket ="sagemaker-us-east-1-158894274492"output_prefix_data_submissions =f"project/submissions/yyyy=*"s3_path =f"s3a://{bucket}/{output_prefix_data_submissions}"print(f"reading submissions from {s3_path}")submissions = spark.read.parquet(s3_path, header=True)print(f"shape of the submissions dataframe is {submissions.count():,}x{len(submissions.columns)}")# Read in the filtered comments%%timeoutput_prefix_data_comments ="project/comments/yyyy=*"s3_path =f"s3a://{bucket}/{output_prefix_data_comments}"print(f"reading comments from {s3_path}")comments = spark.read.parquet(s3_path, header=True)print(f"shape of the comments dataframe is {comments.count():,}x{len(comments.columns)}")# Read in the external data setall_salary_info = pd.read_csv("../data/external_data/all_company_salary_info_CLEAN.csv")# Drop index columnall_salary_info = all_salary_info.drop(["Unnamed: 0"], axis =1)# Round float valuesall_salary_info = all_salary_info.apply(lambda x: round(x, 2) if x.dtype =='float64'else x)# Get just the tech salariestech_df = all_salary_info[all_salary_info["role_type"] =="tech"]# Getting only the columns we need for cubmissions and commentssubmissions_subset_col = submissions.select("id", "subreddit", "subreddit_id", "title", "selftext", col("created_utc").alias("created_utc_submission"), "num_comments")comments_subset_col = comments.select("link_id", "body", col("created_utc").alias("created_utc_comment"))# Making an "searchable_text" column for taggingsubmissions_subset_col = submissions_subset_col.withColumn("searchable_text", concat(submissions_subset_col["title"], lit(" "), submissions_subset_col["selftext"]))## TAGGING SUBMISSIONSkeywords_is_tech = ["tech", "technology", "code", "coding", "computer", "data", "python","java", "javascript", "sql", "database", "statistics", "azure", "cloud computing", "progamming", "leetcode", "saas", "faang"]pattern ="(?i)"+"|(?i)".join(keywords_is_tech)submissions_tagged = submissions_subset_col\ .withColumn('is_tech_submissions', col('searchable_text').rlike(pattern))keywords_help = ["help me", "struggle", "struggling", "anyone", "advice", "tips", "help"]pattern ="(?i)"+"|(?i)".join(keywords_help)submissions_tagged = submissions_tagged\ .withColumn('is_asking_for_help_submissions', col('searchable_text').rlike(pattern))submissions_tagged = submissions_tagged\ .withColumn('is_asking_a_question_submissions', col('searchable_text').rlike(r'(\?)+'))keywords_faang = ["facebook", "amazon", "apple", "netflix", "google"]pattern ="(?i)"+"|(?i)".join(keywords_faang)submissions_tagged = submissions_tagged\ .withColumn('is_FAANG_submissions', col('searchable_text').rlike(pattern))\ .cache()# Store companies mentioned in Reddit text from companies present in the external data setcompanies =list(tech_df.company.unique())# Make a udf to get mentioned companies @udf(ArrayType(StringType()))def get_company_mentions(text):return [company for company in companies if" "+ company.lower() +" "in text.lower()]submissions_tagged = submissions_tagged.withColumn("company_mentions", get_company_mentions(col("searchable_text")))# Make another UDF to make final tagged column (if none found - NA, if 2+ found, "Multiple", else put the company mentioned@udf(StringType())def clean_company_mentions(company_list):ifnot company_list:returnNoneeliflen(company_list) >1:return"Multiple"else:return company_list[0]submissions_tagged = submissions_tagged.withColumn("final_company_mentioned", clean_company_mentions(col("company_mentions")))## TAGGING COMMENTSkeywords_is_tech = ["tech", "technology", "code", "coding", "computer", "data", "python","java", "javascript", "sql", "database", "statistics", "azure", "cloud computing", "progamming", "leetcode", "saas", "faang"]pattern ="(?i)"+"|(?i)".join(keywords_is_tech)comments_tagged = comments_subset_col\ .withColumn('is_tech_comments', col('body').rlike(pattern))keywords_help = ["help me", "struggle", "struggling", "anyone", "advice", "tips", "help"]pattern ="(?i)"+"|(?i)".join(keywords_help)comments_tagged = comments_tagged\ .withColumn('is_asking_for_help_comments', col('body').rlike(pattern))comments_tagged = comments_tagged\ .withColumn('is_asking_a_question_comments', col('body').rlike(r'(\?)+'))keywords_faang = ["facebook", "amazon", "apple", "netflix", "google"]pattern ="(?i)"+"|(?i)".join(keywords_faang)comments_tagged = comments_tagged\ .withColumn('is_FAANG_comments', col('body').rlike(pattern))\ .cache()# Store companies mentioned in Reddit text from companies present in the external data setcompanies =list(tech_df.company.unique())# Make a udf to get mentioned companies @udf(ArrayType(StringType()))def get_company_mentions(text):return [company for company in companies if" "+ company.lower() +" "in text.lower()]comments_tagged = comments_tagged.withColumn("company_mentions", get_company_mentions(col("body")))# Make another UDF to make final tagged column (if none found - NA, if 2+ found, "Multiple", else put the company mentioned@udf(StringType())def clean_company_mentions(company_list):ifnot company_list:returnNoneeliflen(company_list) >1:return"Multiple"else:return company_list[0]comments_tagged = comments_tagged.withColumn("final_company_mentioned", clean_company_mentions(col("company_mentions")))## JOIN COMMENTS AND SUBMISSIONS# Rename some columns for this reformattingcomments_tagged = (comments_tagged .withColumnRenamed("company_mentions", "company_mentions_comments") .withColumnRenamed("final_company_mentioned", "final_company_mentioned_comments"))submissions_tagged = (submissions_tagged .withColumnRenamed("company_mentions", "company_mentions_submissions") .withColumnRenamed("final_company_mentioned", "final_company_mentioned_submissions"))# Clean comments link_id "t3_#####" to match submissions id "#####"comments_new_id = comments_tagged.withColumn('link_id', expr("substring(link_id, 4, length(link_id)-3)"))# Join comments with submissionsdf = comments_new_id.join(submissions_tagged, comments_new_id['link_id'] == submissions_tagged['id'], 'outer')# Reformatting# Separate into two dataframes (comments and submissions)df_submissions = df.filter(df.created_utc_submission.isNotNull())\ .select( F.col('id').alias('link_id'), F.col('created_utc_submission').alias('created_utc'), F.col('searchable_text').alias('body'), F.col('is_tech_submissions').alias('is_tech'), F.col('is_asking_for_help_submissions').alias('is_asking_for_help'), F.col('is_asking_a_question_submissions').alias('is_asking_a_question'), F.col('is_FAANG_submissions').alias('is_FAANG'), F.col('company_mentions_submissions').alias('company_mentions'), F.col('final_company_mentioned_submissions').alias('final_company_mentioned'), F.lit(True).alias('isSubmission') )\ .distinct()df_comments = df.filter(df.created_utc_comment.isNotNull())\ .select('link_id', F.col('created_utc_comment').alias('created_utc'),'body', F.col('is_tech_comments').alias('is_tech'), F.col('is_asking_for_help_comments').alias('is_asking_for_help'), F.col('is_asking_a_question_comments').alias('is_asking_a_question'), F.col('is_FAANG_comments').alias('is_FAANG'), F.col('company_mentions_comments').alias('company_mentions'), F.col('final_company_mentioned_comments').alias('final_company_mentioned'), F.lit(False).alias('isSubmission') )\ .distinct()# Concatenate comments and submissionsdf_clean = df_submissions.union(df_comments)## MERGE WITH EXTERNAL DATA SET# Rename for mergedf_clean = (df_clean .withColumnRenamed("final_company_mentioned", "company"))# Convert external to spark data frametech_spark_df = spark.createDataFrame(tech_df)# Join on final_company_mentioned columnmerged_df = df_clean.join(tech_spark_df, on ="company", how ="left")
id
comment timestamp
body
technical comment
asking for help?
asking a question?
FAANG comment
company mentions
wghtce
2022-08-05 01:11:58
Applying for Simi…
False
False
False
False
[]
sbtver
2022-01-24 19:13:22
Leetcode Premium …
True
False
False
False
[]
ue9ggm
2022-04-29 00:32:14
Explanation of Le…
True
False
False
False
[]
submission
role type
average yearly compensation
average years experience
average years at company
average base salary
average stock grant value
average bonus
True
Null
Null
Null
Null
Null
Null
Null
True
Null
Null
Null
Null
Null
Null
Null
True
Null
Null
Null
Null
Null
Null
Null
Data Quality Checks
At this point, the data has been cleaned and new variables have been created. This next section aims to perform quality checks on said dataset. Being aware of key dataset characteristics like schema, overall structure, and missing values helps in detecting any inconsistencies, errors, or gaps that could influence subsequent analyses.
# Check for nullsmerged_df.select([count(when(col(c).isNull(), c)).alias(c) for c in merged_df.columns]).show()
Null Count by Column:
column
number of nulls
company
8111
body
8111
is_tech
8111
is_asking_for_help
8111
is_asking_a_question
8111
is_FAANG
934
company_mentions
934
isSubmission
934
role_type
934
average_yearly_compensation
934
average_years_experience
934
Most of the company salary information is null in the data set after the merge, which is expected. Many subreddits mention no companies at all, some mention multiple, and some probably have mentioned companies not listed in the external data set. For the visualizations below, the nulls were removed to create a smaller, less sparse data set.
TOPIC 4: MARKET SALARY TREND ANALYSIS
Goal: Connect salary information on various firms with the firms discussed in the Reddit submissions and comments. Identify the firms that offer the highest salaries and contrast them with the firms that are discussed most frequently in the context of job hunting and interviewing. Also devote particular attention to the firms represented by the FAANG acronym to build off prior examination of these firms from the EDA stage.
Below are two bar plots showing the distribution of submission counts and comment counts by company. Nulls, “Other”, and “Multiple” tagged rows were removed to just isolate the submissions and comments that mention one company specifically. Abnormal company names such as “Here” and “Test” were removed as well. Additionally, company counts with less than 5 occurrences were removed to make sure the plot did not get too cluttered and unreadable.
Code
# Separate df into submissions and commentsfiltered_df = df.filter(df['company'].isNotNull()) # take out Nullssubmissions = filtered_df.filter(filtered_df.isSubmission ==True)comments = filtered_df.filter(filtered_df.isSubmission ==False)# Get the frequency of posts and comments by companysubmission_freqs = submissions.groupBy('company').count().orderBy('company')comments_freqs = comments.groupBy('company').count().orderBy('company')# Convert counts to pandassubmission_freqs = submission_freqs.toPandas()comments_freqs = comments_freqs.toPandas()# Filter out "Other" and "None" and "Multiple" to just get individual companiesexclude = ['Other', 'None', 'Multiple', 'Test', 'Here']submission_freqs = submission_freqs[~submission_freqs['company'].isin(exclude)]comments_freqs = comments_freqs[~comments_freqs['company'].isin(exclude)]# Filter out companies with small countssubmission_freqs = submission_freqs[submission_freqs['count'] >5]comments_freqs = comments_freqs[comments_freqs['count'] >5]# Plottingplt.figure(figsize = (60, 60))submission_freqs = submission_freqs.sort_values(by ='count', ascending =True)comments_freqs = comments_freqs.sort_values(by ='count', ascending =True)plt.subplot(1, 2, 1)bars = plt.barh(submission_freqs['company'].astype(str), submission_freqs['count'].astype(int), color ='#251279')plt.xlabel('No. of Submissions', fontsize =60)plt.tick_params(axis ='x', which ='major', labelsize =50) plt.tick_params(axis ='y', which ='major', labelsize =50) plt.title('Number of Submissions by Company', fontsize =60)plt.bar_label(bars, labels = submission_freqs['count'].astype(int), padding =3, fontsize =50)plt.subplot(1, 2, 2)bars = plt.barh(comments_freqs['company'].astype(str), comments_freqs['count'].astype(int), color ='#40B389')plt.xlabel('No. of Comments', fontsize =60)plt.tick_params(axis ='x', which ='major', labelsize =50) plt.tick_params(axis ='y', which ='major', labelsize =50) plt.title('Number of Comments by Company', fontsize =60)plt.bar_label(bars, labels = comments_freqs['count'].astype(int), padding =3, fontsize =50)plt.figtext(0.05, -0.02, 'Note: Companies with less than 5 mentions are not included. Additionally, posts mentioning multiple or "Other" companies are not included.', fontsize =50, color='black')plt.tight_layout()# Save figureplt.savefig('../../website-source/images/submissions_comments_by_company.png', dpi =300)plt.show()
As expected, Amazon and Google are the clear front-runners, surpassing other “FAANG” companies like Apple, Netflix, and Facebook. Medium is an interesting front-runner as well. Medium provides a lot of informative articles and code samples, so this might explain the reason for the high count of submissions and comments mentioning Medium.
Top 20 Companies Mentioned with Compensation Comparison
Below are the total mention counts for the top twenty companies.
With this list of top twenty companies, the compensation metrics can be compared to see if any possible relationships arrive.
Code
# Aggregate data by company and calculate the mean for each metricdata_by_company = tech_df.groupby('company')[column_list].mean().reset_index()company_list = ["Google", "Medium", "Move", "Amazon", "NICE", "Wish", "Discord", "zoom", "Target", "Reddit", "Match", "GitHub", "Microsoft", "Indeed", "HackerRank", "Gap", "Button", "Facebook", "Wise", "Intuitive"]data_by_company["top10"] = data_by_company["company"].isin(company_list)top20 = data_by_company[data_by_company["top10"] ==True]ordered_top20 = {"average_yearly_compensation": list(top20.sort_values('average_yearly_compensation', ascending =False)['company']),"average_years_experience": list(top20.sort_values('average_years_experience', ascending =False)['company']),"average_years_at_company": list(top20.sort_values('average_years_at_company', ascending =False)['company']),"average_base_salary": list(top20.sort_values('average_base_salary', ascending =False)['company']),"average_stock_grant_value": list(top20.sort_values('average_stock_grant_value', ascending =False)['company']),"average_bonus": list(top20.sort_values('average_bonus', ascending =False)['company'])}# Create bar plots for each metricbar_charts = []for i inrange(len(title_list)): chart = alt.Chart(top20).mark_bar().encode( x = alt.X('company', title ='Company', sort = ordered_top20[column_list[i]]), y = alt.Y(column_list[i], title = x_axis_list[i]), color = alt.ColorValue(color_list[i]) ).properties( title =f"{title_list[i]} for Top 10 Mentioned Companies", width =400, height =220 ) bar_charts.append(chart)# Concatenate bar charts in a grid layoutfinal_bars = alt.vconcat( alt.hconcat(bar_charts[0], bar_charts[1]), alt.hconcat(bar_charts[2], bar_charts[3]), alt.hconcat(bar_charts[4], bar_charts[5]))
FAANG companies like Facebook, Amazon and Google tend to be in the top half of the top twenty most mentioned companies regarding these compensation metrics. Overall, the charts suggest that there is a mixture of FAANG and non-FAANG companies that offer high compensation. It is interesting to see that companies with the highest compensation, do not necessarily observe the most years of experience or years at the compnay suggesting other factors play a role in compensation packages. The plot also shows variability in how long employees stay with these companies, which implies that factors other than compensation may influence tenure.
2) Conducting Natural Language Processing Work
Topic 5: NLP Trends for Reddit Interview Content
Goal: Identify topics within the posts/comments of the interview subreddits to uncover general themes for students to study further. This can highlight what types of subject matter are being discussed the most, whether coding topics or behavioral questions.
From a technical perspective, this portion of the analysis begins with identifying the most common words across the dataset, using techniques such as tokenization, stop words removal, and word count aggregation. Next, the analysis explores the distribution of text lengths, offering a statistical overview of the dataset’s text size. The third step involved identifying important words using Term Frequency-Inverse Document Frequency (TF-IDF), a method that highlights words that are unique to specific documents within the corpus. Transforming of text data using multiple NLP techniques like URL removal, tokenization, normalization, and stemming created a cleaner version of the dataset for improved text analysis. The creation of dummy variables based on regex patterns enables the categorization of texts into different technical domains such as programming languages and coding libraries.
From a business perspective, the technical analysis in this section accomplishes goals such as insight into key topics and trends as well as data-driven decision making. By identifying the most common words and important terms (via TF-IDF), the analysis uncovers the main themes and topics prevalent in the dataset. This can be crucial for job seekers in understanding prevalent interview trends or job seeker concerns.
Most Common Words Overall
The table below shows that the most common words table shows the terms, “leetcode” and “questions” which might be helpful in steering job applicants to focus their study efforts on this subject.
Code
from pyspark.sql import SparkSessionfrom pyspark.sql.functions import length, explode, splitfrom pyspark.ml.feature import Tokenizer, StopWordsRemover, CountVectorizer, IDFfrom pyspark.sql.functions import colimport matplotlib.pyplot as plt# tokenize tokenizer = Tokenizer(inputCol="body", outputCol="words")df_words = tokenizer.transform(df)# remove stop words remover = StopWordsRemover(inputCol="words", outputCol="filtered_words")df_filtered = remover.transform(df_words)# explode the array into wordsdf_exploded = df_filtered.select(explode(col("filtered_words")).alias("word"))# filter out single character wordsdf_filtered_single_char = df_exploded.filter(length(col("word")) >1)# count df_word_count = df_filtered_single_char.groupBy("word").count()df_word_count.orderBy(col("count").desc()).show()
word
count
Interview
22631
Like
18719
Get
17015
Questions
13818
Time
13330
One
13245
Good
12364
Know
11881
Job
11718
Leetcode
11557
Think
11144
Also
9331
Want
9048
Really
8620
Need
8564
Problems
8560
[deleted]
8453
Problem
8444
Work
8017
First
7521
Distribution of Text Lengths
These statistics confirm that the dataset contains a significant amount of posts/comments with an average length of about 234 characters. The standard deviation is quite high, indicating a large variability in the length of texts.
Code
# calc length of each textdf = df.withColumn("text_length", length(df["body"]))df.describe("text_length").show()
summary
text length
Count
128339
Mean
233.57049688715043
Standard Deviation
480.0254950591896
Minimum
1
Maximum
38271
Important Words According to TF-IDF
The provided list of words and their TF-IDF scores provides insight into the topics and concerns that are most prominent in the Reddit posts and comments surround technical interviews. The most important term, ‘spaced’, is an unusual observation as it does not offer clarity as to why it would be a key concept in technical interview Reddits. Other terms such as ‘interview’, ‘simple’, and ‘subscribe’ are more in line with expectations as they indicate a focus on interview processes, seeking simple advice or interview resources, and potentially encouraged to follow or subscribe to threads or channels for updates on interview strategies. The presence of emotionally charged words like ‘ugh’ and ‘crushing’ may reflect the anxiety and difficulty of technical interview preparation.
Code
# term frequencydf_sampled = df_filtered.sample(False, 0.1)cv = CountVectorizer(inputCol="filtered_words", outputCol="raw_features")cv_model = cv.fit(df_sampled)df_featurized = cv_model.transform(df_sampled)# idfidf = IDF(inputCol="raw_features", outputCol="features")idf_model = idf.fit(df_featurized)df_rescaled = idf_model.transform(df_featurized)tf_idf_pandas_df = df_rescaled.select("features").toPandas()def extract_top_words(features, vocabulary, n_top_words=3): dense_vector = features.toArray() top_indices = dense_vector.argsort()[-n_top_words:][::-1] top_words = [(vocabulary[i], dense_vector[i]) for i in top_indices]return top_wordsvocabulary = cv_model.vocabulary# extract top words for each rown_top_words =1top_words_list = [extract_top_words(row['features'], vocabulary, n_top_words) for index, row in tf_idf_pandas_df.iterrows()]top_words_list[35:45]
Word
TF-IDF Score
Spaced
13.378421024061316
Bud
8.768652053710493
Pill
8.768652053710493
Interview
8.768652053710493
Simple
9.794902085605205
Ugh
7.670039765042384
Rated
7.6700397650423845
Crushing
7.2645746569342196
[deleted]
2.7537151504173694
Subscribe
7.159214141276394
Cleaning the Text Using 5+ NLP Techniques
In this section, more detailed text cleaning techniques are put in place. The following code used Spark NLP methods such as tokenizing, stemming, removing punctuation, removing stop words, and more to clean the Reddit content.
messaging 21 days 20230128 065831 utc remind link click link send pm also reminded reduce spam parent commenter delete message hide others info reminders sorry didnt see thank howd get change anything prep strategy
Topic 6: Identification of Most Important Skills for Technical Interviewing
Goal: Hone in on the most important and most frequent skills discussed on Reddit for technical interviews. Explore mention frequency of various programming languages, tools, and libraries. Also identify the most important stages of the technical interview.
Creating New Dummy Variables
To focus on topics such as programming languages, tools, and libraries, new variables are required.
Statistical summary table for regex patterns from new variables:
total count
sum of programming languages mentioned
sum of coding libraries mentioned
sum of ds tools mentioned
sum of interview stages mentioned
128339
5188
53
1004
476
Visualization for regex patterns from new variables:
The extraction and visualization of patterns through regex-based categorization, encompassing elements like programming languages and coding libraries, offers additional guidance. The sundial visualization, for example, highlights the prevalence of programming languages, especially Python, within the text. This observation can streamline a job applicant’s study plan by emphasizing Python, thereby optimizing interview preparation and enhancing their chances of success.
Code
# filter out row where no programming language is mentioneddf_w_languages = clean_df_nlp_var.filter(col("programming_language_mentioned")==1)df_w_libraries = clean_df_nlp_var.filter(col("coding_library_mentioned")==1)df_w_tools = clean_df_nlp_var.filter(col("ds_tool_mentioned")==1)df_w_stage = clean_df_nlp_var.filter(col("interview_stage_mentioned")==1)# write function to extract language frequency in each text def extract_pattern(pattern,text):return re.findall(pattern, text) # create udfextract_pattern_udf = udf(extract_pattern, ArrayType(StringType()))# add a column with the pattern to the DataFramesdf_w_languages = df_w_languages.withColumn("pattern", lit(language_pattern))df_w_libraries = df_w_libraries.withColumn("pattern", lit(library_pattern))df_w_tools = df_w_tools.withColumn("pattern", lit(tool_pattern))df_w_stage = df_w_stage.withColumn("pattern", lit(stage_pattern))# apply the UDF df_w_languages = df_w_languages.withColumn("mentioned_languages", extract_pattern_udf(col("pattern"), col("clean_body")))df_w_libraries = df_w_libraries.withColumn("mentioned_libraries", extract_pattern_udf(col("pattern"), col("clean_body")))df_w_tools = df_w_tools.withColumn("mentioned_tools", extract_pattern_udf(col("pattern"), col("clean_body")))df_w_stage = df_w_stage.withColumn("mentioned_stages", extract_pattern_udf(col("pattern"), col("clean_body")))# explode the mentioned languagesexploded_languages = df_w_languages.withColumn("language", explode(col("mentioned_languages")))exploded_libraries = df_w_libraries.withColumn("library", explode(col("mentioned_libraries")))exploded_tools = df_w_tools.withColumn("tool", explode(col("mentioned_tools")))exploded_stages = df_w_stage.withColumn("stage", explode(col("mentioned_stages")))# group by language and countlanguage_cts = exploded_languages.groupBy("language").count()library_cts = exploded_libraries.groupBy("library").count()tool_cts = exploded_tools.groupBy("tool").count()stage_cts = exploded_stages.groupBy("stage").count()# add col describing patternlanguage_cts = language_cts.withColumn("pattern_topic", lit("programming language"))library_cts = library_cts.withColumn("pattern_topic", lit("coding library"))tool_cts = tool_cts.withColumn("pattern_topic", lit("data science tool"))stage_cts = stage_cts.withColumn("pattern_topic", lit("interview stage"))language_cts = language_cts.withColumnRenamed("language", "pattern")library_cts = library_cts.withColumnRenamed("library", "pattern")tool_cts = tool_cts.withColumnRenamed("tool", "pattern")stage_cts = stage_cts.withColumnRenamed("stage", "pattern")# convert to pandas for future visualizationlanguage_cts_pd = language_cts.toPandas()library_cts_pd = library_cts.toPandas()tool_cts_pd = tool_cts.toPandas()stage_cts_pd = stage_cts.toPandas()# union pd dataframes for visualizations latercombined_cts_pd = pd.concat([language_cts_pd, library_cts_pd, tool_cts_pd, stage_cts_pd], ignore_index=True)# visualizecolor_map = {'programming language': '#163d6b', 'coding library': '#204321','data science tool': '#82B8B5' ,'interview stage' :'#5E9751'}fig = px.sunburst( combined_cts_pd, path=['pattern_topic', 'pattern'], values='count', color='pattern_topic', color_discrete_map=color_map, title='Distribution of RegEx Topic Patterns')fig.update_layout(width=650, height=650)fig.show()
3) Building a Sentiment Model
Topic 7: Sentiment Analysis of Interview Posts & Comments
Goal: Observe the overall sentiment of posts and comments related to the filtered dataset that focuses on interviews. This will help identify how candidates are feeling about the interview process, which can draw insight into a specific employer or topic interview difficulty level.
For the purpose of the sentiment analysis, spark jars packages and the John Snow Labs pagckage were used. The John Snow Labs package includes several pre-trained models. The one best suited for this analysis is the sentimentdl_use_twitter. The models consist of four parts. The first part, documentAssembler, takes as an input the text column (in this case ‘body’ column). The second part, the use part, has the Universal Sentence Encoder that utilizes the TenserFlow Hub use. The input of the second part is the output of the first documentAssembler part. Part three is the sentiment deep learning pretrained model that takes as the input the output of the second part and utilizes the John Snow Labs sentimentdl_use_twitter model with the English languge. This part outputs the sentiments for each row of the ‘body’ text column. The final part is the NLP Pipeline, which puts all the previous parts together, allowing the input of the data frame into the pipeline. The pipline runs through all the previously mentioned parts and produces a new sentiment column with three sentiment options - postive, neutral, negative. The last step in the sentiment analysis is transforming the output of the pipeline into a results dataframe.
Below is a table that provides a glimpse at the data in terms of how the sentiment analysis created a new variable that allows further analysis, such as what does sentiment look like for the entire dataset, or for sepcific attributes such as posts/comments that focus on asking for help or FAANG companies.
Code
from pyspark.sql.functions import explode, col# Explode the sentiment array and extract the result fieldresults = results.withColumn('sentiment', F.explode('sentiment'))results = results.withColumn('sentiment', F.col('sentiment.result'))# Selecting columns for the final DataFramefinal_data = results.select('is_tech', 'is_asking_for_help', 'is_asking_a_question', 'is_FAANG', 'clean_body', 'sentiment')# Persist and show the DataFramefinal_data.persist()final_data.show()
technical reddit
asking for help?
asking a question?
FAANG reddit
clean body
sentiment
True
False
False
False
messaging 21 days…
Neutral
True
False
True
False
sorry didnt see t…
Positive
False
False
False
False
howd get
Positive
Full Dataframe Sentiment Counts
The large number of positive sentiments suggests that although there is a strong presence of positive discourse, there is also a substantial number of negative experiences or thoughts being shared.
The is_tech column represents a subset of the data where the focus is on technical aspects of interviews. The sentiment analysis summary for this subset of data shows positive sentiments far outnumber the negatives, suggesting that discussions in this category are generally more positive. This is surprising as the technical aspect of interviews are usually the most stressful so this provides a bit of hope to those starting the long road of technical interview preparation.
Code
tech_data = final_data.filter(col('is_tech') ==True)sentiment_counts = tech_data.groupBy('sentiment').count()print('Sentiment Counts for is_tech Column')sentiment_counts.show()
sentiment
count
Positive
20776
Neutral
979
Negative
7629
Sentiment Counts for is_asking_for_help Column
The is_asking_for_help column represents a data subset focusing on posts where individuals are seeking assistance. Positive sentiment is almost double the negative sentiment, which may signify a supportive environment for those asking for help, again providing hope for those starting the challenge of preparing for technical interviews.
Code
help_data = final_data.filter(col('is_asking_for_help') ==True)sentiment_counts = help_data.groupBy('sentiment').count()print('Sentiment Counts for is_asking_for_help Column')sentiment_counts.show()
sentiment
count
Positive
9839
Neutral
346
Negative
4602
Sentiment Counts for is_asking_a_question Column
The table below shows a higher number of positive sentiments than negative ones for posts/comments that ask a question. This might suggest that the Reddit community is usually supportive when individuals ask questions, creating an environment for information exchange and learning. Having knowledge of this may encourage new users seeking advice for technical interview to be less afraid in asking questions.
sentiment
count
Positive
20014
Neutral
867
Negative
13028
Sentiment Counts for is_FAANG Column
The is_FAANG posts/comments discussing interviews at FAANG companies (Facebook, Amazon, Apple, Netflix, Google), show that sentiment is more positive than negative. This indicates that conversations around interviews at these top tech companies are more positive, which could be due to successful interview experiences or helpful insights posted by users who have interviewed with these companies.
Code
question_data = final_data.filter(col('is_asking_a_question') ==True)sentiment_counts = question_data.groupBy('sentiment').count()print('Sentiment Counts for is_asking_a_question Column')sentiment_counts.show()
sentiment
count
Positive
3488
Neutral
171
Negative
1554
Plot of Summary Statistics
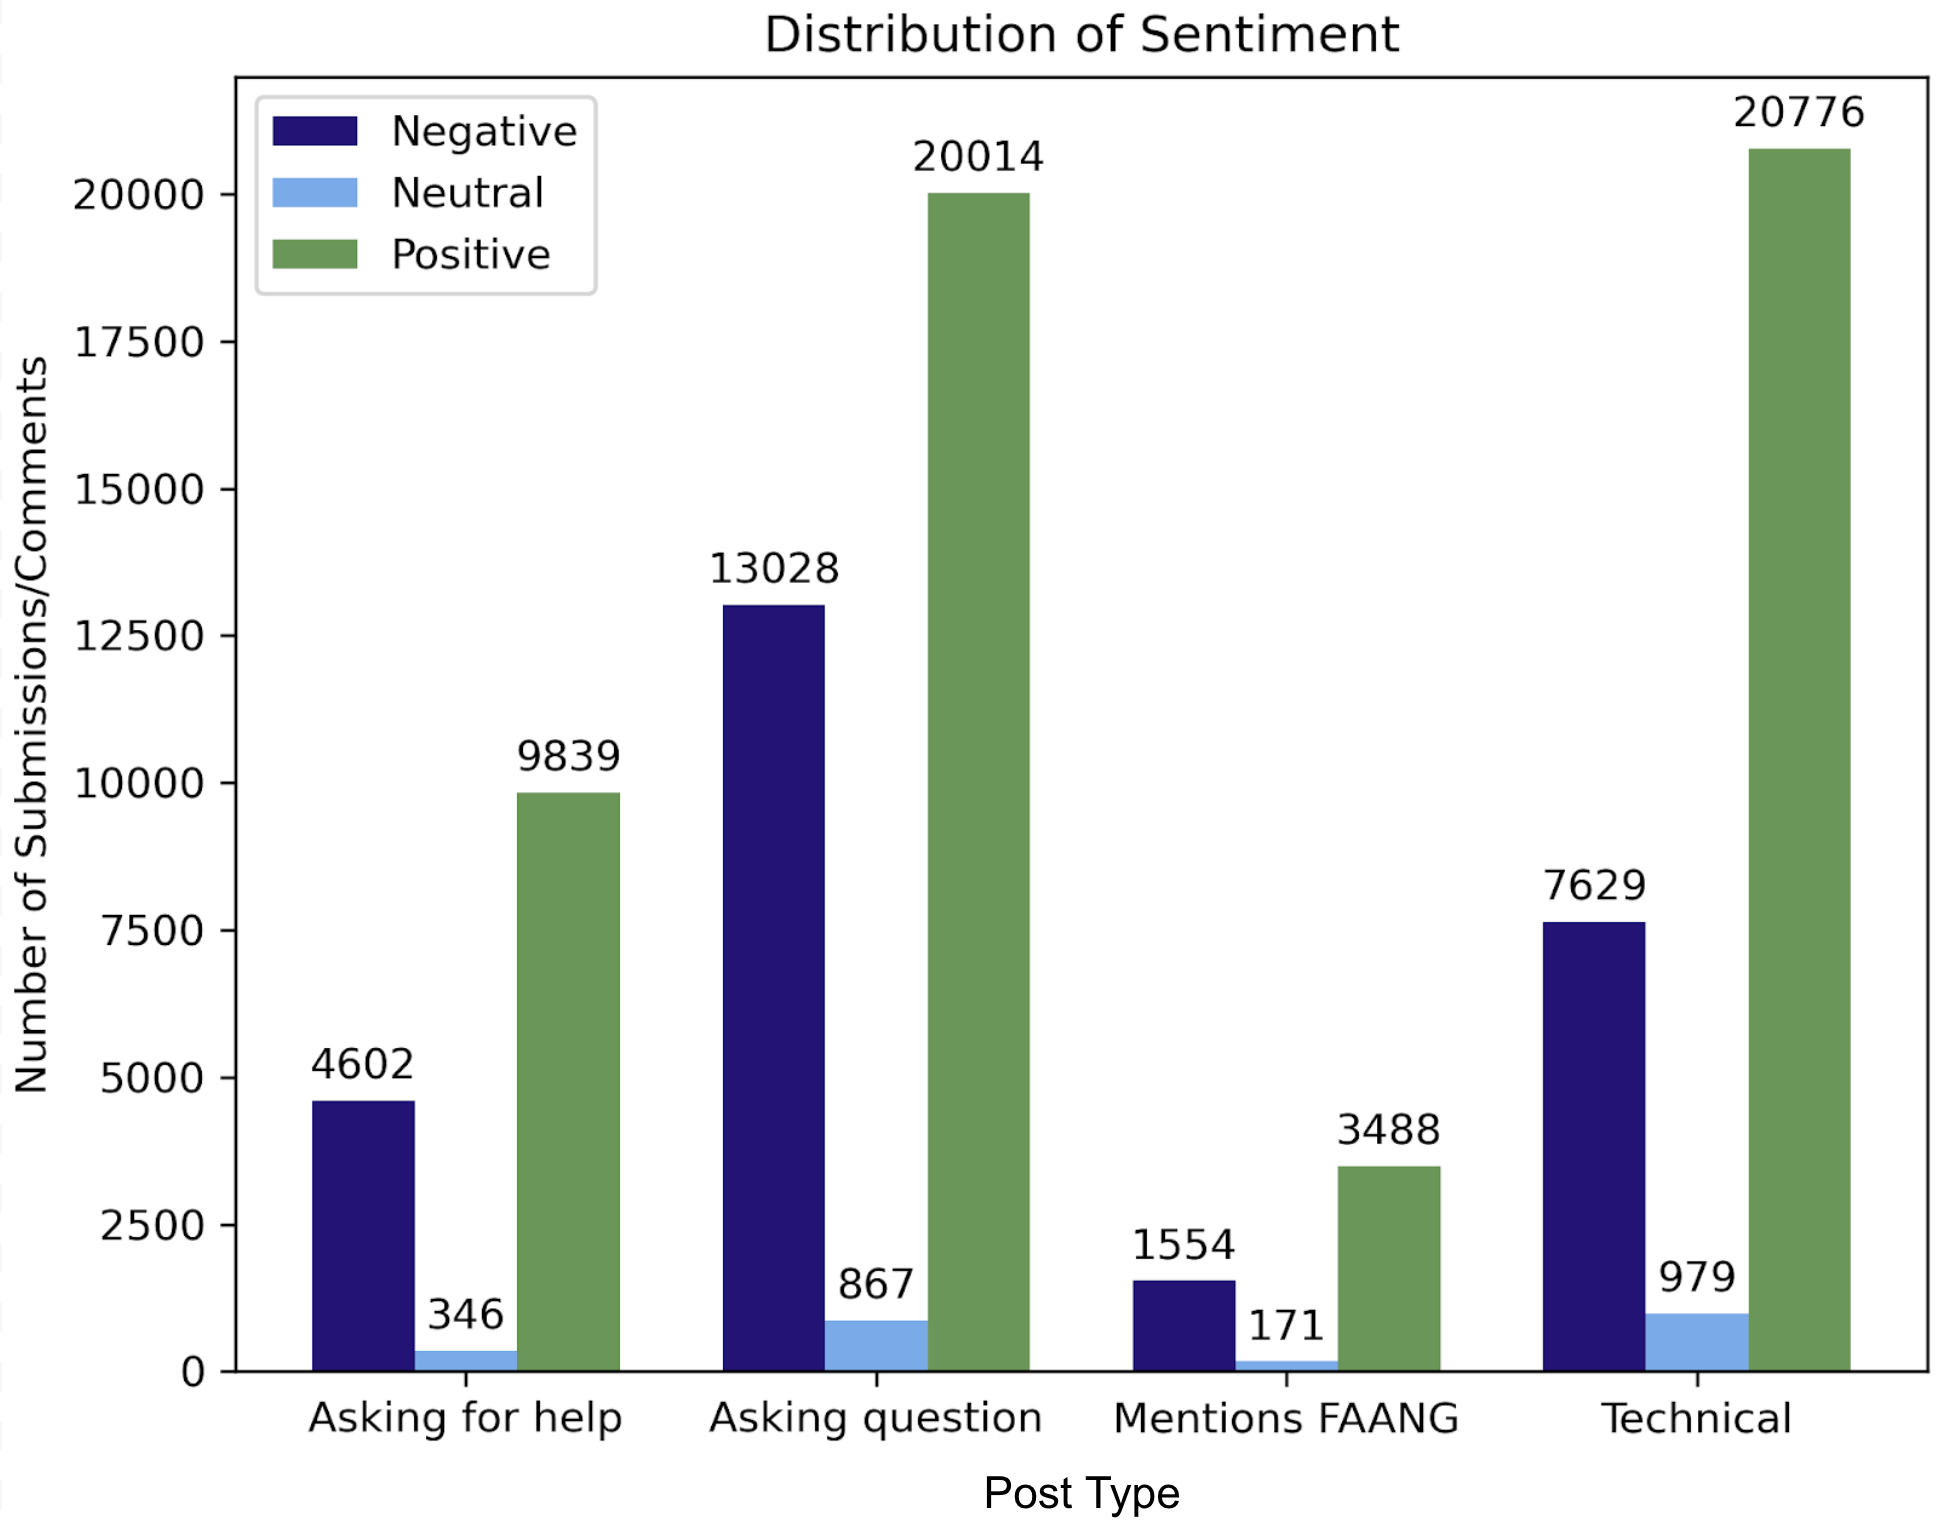
The plot below displays a more succinct summary of the count of posts (submissions and comments) for each sentiment classification broken down by post type. Again, the text content types include:
A post asking for help
A post asking a question
A post mentioning a FAANG company
A technical post
These topics were found using Regex as described above and in previous parts of the website. In general, for the full dataset, there are mainly postive sentiments for submissions and comments. The positive submissions and comments are almost double in size as compared to the submissions and comments with negative sentiment. For texts where is_tech column is true the ratio of postive to negative sentiments is higher than for any other column. The opposite is true for the rows where is_asking_for_help column is true. The number of neutral sentiments is the lowest in the whole dataset and as well in relation to the other sentiments for all the options where column_name = True.
Code
import pyspark.sql.functions as Fimport pandas as pd# Get sentiment counts for submissions/comments that ask for helpdf_tech_counts = df\ .filter(F.col('is_tech'))\ .groupBy('sentiment')\ .count()\ .withColumn('category', F.lit('Technical'))# Get sentiment counts for submissions/comments that ask for helpdf_help_counts = df\ .filter(F.col('is_asking_for_help'))\ .groupBy('sentiment')\ .count()\ .withColumn('category', F.lit('Asking for help'))# Get sentiment counts for submissions/comments that ask a questiondf_question_counts = df\ .filter(F.col('is_asking_a_question'))\ .groupBy('sentiment')\ .count()\ .withColumn('category', F.lit('Asking question'))# Get sentiment counts for submissions/comments that mention a FAANG# companydf_FAANG_counts = df\ .filter(F.col('is_FAANG'))\ .groupBy('sentiment')\ .count()\ .withColumn('category', F.lit('Mentions FAANG'))# Concatenate the count dfs together and convert to pandasdf_count_summary = df_tech_counts\ .union(df_help_counts)\ .union(df_question_counts)\ .union(df_FAANG_counts)\ .toPandas()# Pivot dataframedf_plot = df_count_summary.pivot(index='category', columns='sentiment', values='count').reset_index()# Code referenced: https://matplotlib.org/stable/gallery/lines_bars_and_markers/bar_colors.htmlimport matplotlib.pyplot as pltimport numpy as npx = np.arange(len(df_plot['category'])) # the label locationswidth =0.25# the width of the barsmultiplier =0color_dict = {'negative': '#251279','neutral': '#6CACED','positive': '#5E9751'}fig, ax = plt.subplots(layout='constrained')# Cycle through each sentiment label (negative, neutral, positive)for sentiment_label in df_plot.columns:# Skip the category columnif sentiment_label !='category': offset = width * multiplier rects = ax.bar( x + offset, df_plot[sentiment_label], width, label=sentiment_label.title(), color=color_dict[sentiment_label] ) ax.bar_label(rects, padding=3) multiplier +=1# Add some text for labels, title and custom x-axis tick labels, etc.ax.set_ylabel('Number of Submissions/Comments')ax.set_title('Distribution of Sentiment')ax.set_xticks(x + width, df_plot['category'])ax.legend(loc='upper left')ax.set_ylim(0, 22000)plt.savefig('../../website-source/images/sentiment_dist.png', dpi=300)plt.show()
Source Code
## Natural Language ProcessingThis webpage focuses on using Natural Language Processing (NLP) techniques to dive into the world of Reddit and uncover insights related to interview subreddits. Main accomplishments include identifying and analyzing the significant themes and sentiments within the data. By using NLP techniques, the commonly discussed topics were supported and extracted, providing a clear understanding of the dominant conversations surrounding technical interview attributes. In addition, external data elevated the ability to extract financial insights related to certain types of companies seeking job applicants. These efforts were important in aligning with the business strategies for the target audience (job seekers and students).Furthermore, sentiment analysis was employed to provide a perspective on the tone of the Reddit discussions. This aspect of the project was particularly enlightening as it revealed the mood and attitudes of subreddit participants towards certain interview aspects. These insights are significantly valuable for helping students in prepare for technical interviews by highlighting common concerns and the overall mood surrounding the interview process. The integration of NLP, in bridging data and decision making showcases how technology can elevate business intelligence and enhance student engagement.### 1) External Data Set#### Cleaning the External Data Set**External Data Source:** [link](https://github.com/yuenherny/um-wqd7003-ds-salary-analysis/tree/main)This data set was combined by the author of the GitHub repository above from two sources: LEVELS.FYI API and a Kaggle dataset on data science and stem salaries (see README in repository linked above). The original data set contains yearly compensation (total, base salary, bonuses, and stock grants), location, years of experience, and years at the company information for STEM and data science roles within over 1500 companies. This data ranges from 2017 to 2021.For the project's purposes, the cleaned data set averages yearly compensation, base salary, bonus, years of experience, and years at company for each company and role type (tech or non-tech). The role type column was created by classifying roles as either "tech" or "non tech". For example, a software engineer would be classified as "tech"; meanwhile, sales is classified as "non tech". From there, the data was subset to include just the tech role information. Additionally, the ability to focus on tech vs. non-tech roles was achieved through filtering. Below is the code used to initially clean the external data set along with a table showing the first 20 rows.```{python}#| warning: False# Import librariesimport osimport openpyxlimport pandas as pdimport numpy as np# Read in the datacompany_names = pd.read_csv("../data/external_data/company_name_matching_RAW.csv")salaries = pd.read_excel("../data/external_data/levels_fyi_salary_data_RAW.xlsx", sheet_name ="data")# Subset columnssalaries_subset = salaries[["timestamp", "company", "title", "totalyearlycompensation", "location", "yearsofexperience", "yearsatcompany", "basesalary", "stockgrantvalue", "bonus"]]# Add a year column and drop timestamp columnsalaries_subset["year"] = pd.to_datetime(salaries_subset["timestamp"]).dt.yearsalaries_subset = salaries_subset.drop(["timestamp"], axis =1)# Change data typesdata_types = {"company": str, "title": str, "totalyearlycompensation": float, "location": str, "yearsofexperience": float, "yearsatcompany": float, "basesalary": float, "stockgrantvalue": float, "bonus": float, "year": int}salaries_subset = salaries_subset.astype(data_types)salaries_subset["year"] = pd.to_datetime(salaries_subset["year"], format="%Y")# Create clean company name matchingcompany_mapping =dict(zip(company_names["Variant"].str.strip(), company_names["Clean Company"]))# Make a new column with the clean company namessalaries_subset = salaries_subset.rename(columns = {"company": "old_company"})salaries_subset["company"] = salaries_subset["old_company"].map(company_mapping)salaries_subset = salaries_subset.drop(["old_company"], axis =1)# Categorize available titles as "tech" or "non tech"role_type_dict = {'Product Manager': 'tech', 'Software Engineer': 'tech','Software Engineering Manager': 'tech', 'Data Scientist': 'tech','Solution Architect': 'tech', 'Technical Program Manager': 'tech','Human Resources': 'non tech', 'Product Designer': 'tech', 'Marketing': 'non tech','Business Analyst': 'tech', 'Hardware Engineer': 'tech', 'Sales': 'non tech', 'Recruiter': 'non tech', 'Mechanical Engineer': 'tech', 'Management Consultant': 'non tech'}salaries_subset["role_type"] = salaries_subset["title"].map(role_type_dict)# Rearrange columnssalaries_subset = salaries_subset[["company", "year", "role_type", "title", "totalyearlycompensation", "location", "yearsofexperience","yearsatcompany", "basesalary", "stockgrantvalue", "bonus"]]# Get a summary table of averages by company and role typesummary_df = salaries_subset.groupby(["company", "role_type"]).agg({"totalyearlycompensation": "mean", "yearsofexperience": "mean","yearsatcompany": "mean", "basesalary": "mean","stockgrantvalue": "mean", "bonus": "mean"}).reset_index()summary_df.columns = ["company", "role_type", "average_yearly_compensation", "average_years_experience", "average_years_at_company", "average_base_salary", "average_stock_grant_value", "average_bonus"]# Subset for just FAANG (Facebook, Amazon, Apple, Netflix, Google)# faang_df = summary_df[(summary_df["company"] == "Facebook") | (summary_df["company"] == "Amazon") | (summary_df["company"] == "Apple") | (summary_df["company"] == "Netflix") | (summary_df["company"] == "Google")]summary_df.head(10)```The plots below depict the distribution of the six numeric variables in the external data set: average yearly compensation, average base salary, average years spent at the company, average years of experience, average stock grant value, and average bonus. From this point forward, the only focus will be on "tech" roles; hence, the figures below depict the distributions for each metric for the tech roles only.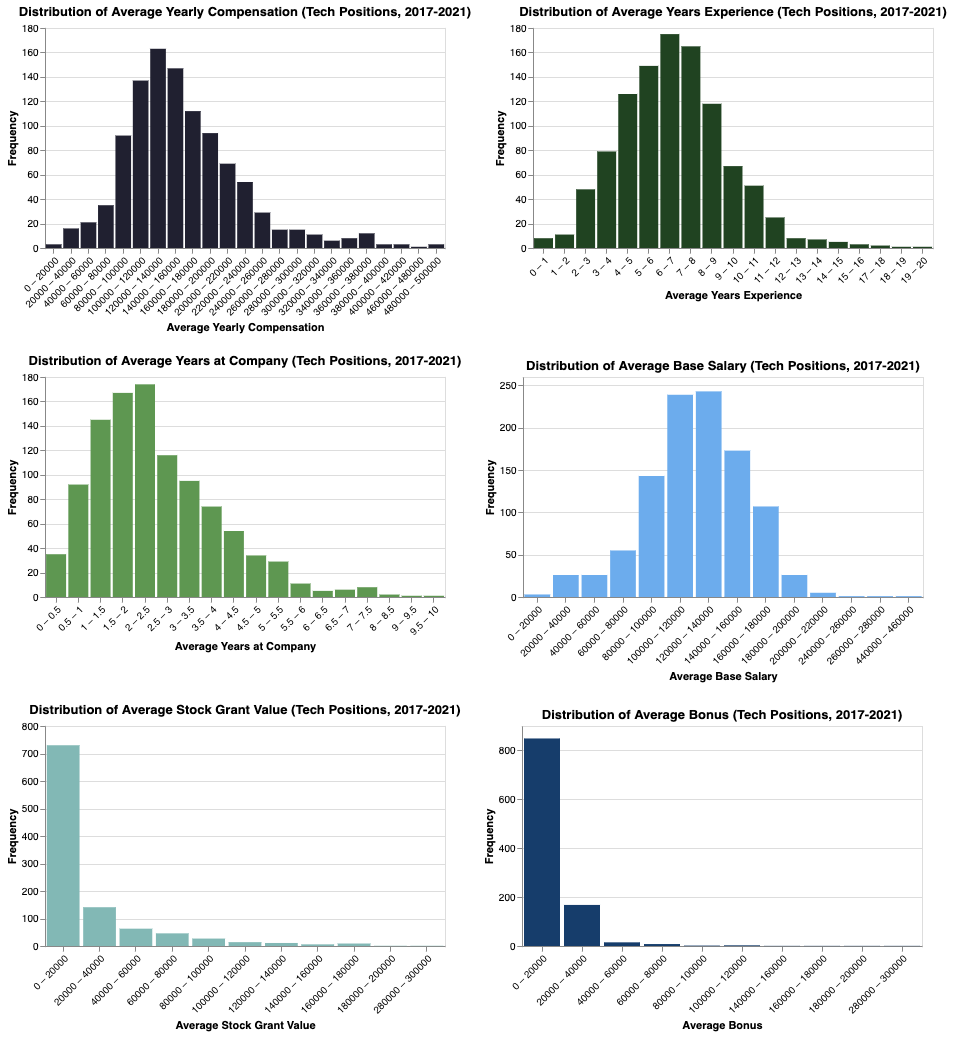{width="1000" height="1100"}In the EDA portion, the data set was tagged based on whether or not a FAANG company was mentioned. FAANG includes Facebook, Apple, Amazon, Netflix, and Google. To take it further, all of the companies present in the external data set were searched for and tagged accordingly. Then, the two data sets were merged based on the company mentioned in each row. This did not apply to cases when multiple companies are mentioned in a post or comment or when no companies were mentioned (Null). Below is the code used to tag the data set with more companies and merge with the external data set.#### Preparing the Reddit Data for Merging```{python}#| eval: False# Import packagesimport timeimport sagemakerimport numpy as npimport pandas as pdimport pyarrow as paimport pyarrow.dataset as dsimport matplotlib.pyplot as pltimport pyspark.sql.functions as Fimport pandas as pdimport datetimefrom pyspark.sql import SparkSessionfrom s3fs import S3FileSystemfrom sagemaker.spark.processing import PySparkProcessorfrom pyspark.sql.functions import concat, lit, lower, col, when, array, expr, count, isnan, length, udffrom pyspark.sql.types import ArrayType, StringType# Build Spark sessionspark = ( SparkSession.builder.appName("PySparkApp") .config("spark.jars.packages", "org.apache.hadoop:hadoop-aws:3.2.2") .config("fs.s3a.aws.credentials.provider","com.amazonaws.auth.ContainerCredentialsProvider", ) .getOrCreate())print(spark.version)# Read in the filtered submissions%%timesession = sagemaker.Session()bucket ="sagemaker-us-east-1-158894274492"output_prefix_data_submissions =f"project/submissions/yyyy=*"s3_path =f"s3a://{bucket}/{output_prefix_data_submissions}"print(f"reading submissions from {s3_path}")submissions = spark.read.parquet(s3_path, header=True)print(f"shape of the submissions dataframe is {submissions.count():,}x{len(submissions.columns)}")# Read in the filtered comments%%timeoutput_prefix_data_comments ="project/comments/yyyy=*"s3_path =f"s3a://{bucket}/{output_prefix_data_comments}"print(f"reading comments from {s3_path}")comments = spark.read.parquet(s3_path, header=True)print(f"shape of the comments dataframe is {comments.count():,}x{len(comments.columns)}")# Read in the external data setall_salary_info = pd.read_csv("../data/external_data/all_company_salary_info_CLEAN.csv")# Drop index columnall_salary_info = all_salary_info.drop(["Unnamed: 0"], axis =1)# Round float valuesall_salary_info = all_salary_info.apply(lambda x: round(x, 2) if x.dtype =='float64'else x)# Get just the tech salariestech_df = all_salary_info[all_salary_info["role_type"] =="tech"]# Getting only the columns we need for cubmissions and commentssubmissions_subset_col = submissions.select("id", "subreddit", "subreddit_id", "title", "selftext", col("created_utc").alias("created_utc_submission"), "num_comments")comments_subset_col = comments.select("link_id", "body", col("created_utc").alias("created_utc_comment"))# Making an "searchable_text" column for taggingsubmissions_subset_col = submissions_subset_col.withColumn("searchable_text", concat(submissions_subset_col["title"], lit(" "), submissions_subset_col["selftext"]))## TAGGING SUBMISSIONSkeywords_is_tech = ["tech", "technology", "code", "coding", "computer", "data", "python","java", "javascript", "sql", "database", "statistics", "azure", "cloud computing", "progamming", "leetcode", "saas", "faang"]pattern ="(?i)"+"|(?i)".join(keywords_is_tech)submissions_tagged = submissions_subset_col\ .withColumn('is_tech_submissions', col('searchable_text').rlike(pattern))keywords_help = ["help me", "struggle", "struggling", "anyone", "advice", "tips", "help"]pattern ="(?i)"+"|(?i)".join(keywords_help)submissions_tagged = submissions_tagged\ .withColumn('is_asking_for_help_submissions', col('searchable_text').rlike(pattern))submissions_tagged = submissions_tagged\ .withColumn('is_asking_a_question_submissions', col('searchable_text').rlike(r'(\?)+'))keywords_faang = ["facebook", "amazon", "apple", "netflix", "google"]pattern ="(?i)"+"|(?i)".join(keywords_faang)submissions_tagged = submissions_tagged\ .withColumn('is_FAANG_submissions', col('searchable_text').rlike(pattern))\ .cache()# Store companies mentioned in Reddit text from companies present in the external data setcompanies =list(tech_df.company.unique())# Make a udf to get mentioned companies @udf(ArrayType(StringType()))def get_company_mentions(text):return [company for company in companies if" "+ company.lower() +" "in text.lower()]submissions_tagged = submissions_tagged.withColumn("company_mentions", get_company_mentions(col("searchable_text")))# Make another UDF to make final tagged column (if none found - NA, if 2+ found, "Multiple", else put the company mentioned@udf(StringType())def clean_company_mentions(company_list):ifnot company_list:returnNoneeliflen(company_list) >1:return"Multiple"else:return company_list[0]submissions_tagged = submissions_tagged.withColumn("final_company_mentioned", clean_company_mentions(col("company_mentions")))## TAGGING COMMENTSkeywords_is_tech = ["tech", "technology", "code", "coding", "computer", "data", "python","java", "javascript", "sql", "database", "statistics", "azure", "cloud computing", "progamming", "leetcode", "saas", "faang"]pattern ="(?i)"+"|(?i)".join(keywords_is_tech)comments_tagged = comments_subset_col\ .withColumn('is_tech_comments', col('body').rlike(pattern))keywords_help = ["help me", "struggle", "struggling", "anyone", "advice", "tips", "help"]pattern ="(?i)"+"|(?i)".join(keywords_help)comments_tagged = comments_tagged\ .withColumn('is_asking_for_help_comments', col('body').rlike(pattern))comments_tagged = comments_tagged\ .withColumn('is_asking_a_question_comments', col('body').rlike(r'(\?)+'))keywords_faang = ["facebook", "amazon", "apple", "netflix", "google"]pattern ="(?i)"+"|(?i)".join(keywords_faang)comments_tagged = comments_tagged\ .withColumn('is_FAANG_comments', col('body').rlike(pattern))\ .cache()# Store companies mentioned in Reddit text from companies present in the external data setcompanies =list(tech_df.company.unique())# Make a udf to get mentioned companies @udf(ArrayType(StringType()))def get_company_mentions(text):return [company for company in companies if" "+ company.lower() +" "in text.lower()]comments_tagged = comments_tagged.withColumn("company_mentions", get_company_mentions(col("body")))# Make another UDF to make final tagged column (if none found - NA, if 2+ found, "Multiple", else put the company mentioned@udf(StringType())def clean_company_mentions(company_list):ifnot company_list:returnNoneeliflen(company_list) >1:return"Multiple"else:return company_list[0]comments_tagged = comments_tagged.withColumn("final_company_mentioned", clean_company_mentions(col("company_mentions")))## JOIN COMMENTS AND SUBMISSIONS# Rename some columns for this reformattingcomments_tagged = (comments_tagged .withColumnRenamed("company_mentions", "company_mentions_comments") .withColumnRenamed("final_company_mentioned", "final_company_mentioned_comments"))submissions_tagged = (submissions_tagged .withColumnRenamed("company_mentions", "company_mentions_submissions") .withColumnRenamed("final_company_mentioned", "final_company_mentioned_submissions"))# Clean comments link_id "t3_#####" to match submissions id "#####"comments_new_id = comments_tagged.withColumn('link_id', expr("substring(link_id, 4, length(link_id)-3)"))# Join comments with submissionsdf = comments_new_id.join(submissions_tagged, comments_new_id['link_id'] == submissions_tagged['id'], 'outer')# Reformatting# Separate into two dataframes (comments and submissions)df_submissions = df.filter(df.created_utc_submission.isNotNull())\ .select( F.col('id').alias('link_id'), F.col('created_utc_submission').alias('created_utc'), F.col('searchable_text').alias('body'), F.col('is_tech_submissions').alias('is_tech'), F.col('is_asking_for_help_submissions').alias('is_asking_for_help'), F.col('is_asking_a_question_submissions').alias('is_asking_a_question'), F.col('is_FAANG_submissions').alias('is_FAANG'), F.col('company_mentions_submissions').alias('company_mentions'), F.col('final_company_mentioned_submissions').alias('final_company_mentioned'), F.lit(True).alias('isSubmission') )\ .distinct()df_comments = df.filter(df.created_utc_comment.isNotNull())\ .select('link_id', F.col('created_utc_comment').alias('created_utc'),'body', F.col('is_tech_comments').alias('is_tech'), F.col('is_asking_for_help_comments').alias('is_asking_for_help'), F.col('is_asking_a_question_comments').alias('is_asking_a_question'), F.col('is_FAANG_comments').alias('is_FAANG'), F.col('company_mentions_comments').alias('company_mentions'), F.col('final_company_mentioned_comments').alias('final_company_mentioned'), F.lit(False).alias('isSubmission') )\ .distinct()# Concatenate comments and submissionsdf_clean = df_submissions.union(df_comments)## MERGE WITH EXTERNAL DATA SET# Rename for mergedf_clean = (df_clean .withColumnRenamed("final_company_mentioned", "company"))# Convert external to spark data frametech_spark_df = spark.createDataFrame(tech_df)# Join on final_company_mentioned columnmerged_df = df_clean.join(tech_spark_df, on ="company", how ="left")```| | link_id | created_utc | body | is_tech | is_asking_for_help | is_asking_a\_question | is_FAANG | company_mentions | isSubmission | role_type | average_yearly_compensation | average_years_experience | average_years_at_company | average_base_salary | average_stock_grant_value | average_bonus ||-----|-----|-----|-----|-----|-----|-----|-----|-----|-----|-----|-----|-----|-----|-----|-----|-----|| null | wghtce | 2022-08-05 01:11:58 | Applying for Simi... | false | false | false | false | \[\] | true | null | null | null | null | null | null | null || null | sbtver | 2022-01-24 19:13:22 | Leetcode Premium ... | true | false | false | false | \[\] | true | null | null | null | null | null | null | null || null | ue9ggm | 2022-04-29 00:32:14 | Explanation of Le... | true | false | false | false | \[\] | true | null | null | null | null | null | null | null |#### Data Quality ChecksAt this point, the data has been cleaned and new variables have been created. This next section aims to perform quality checks on said dataset. Being aware of key dataset characteristics like schema, overall structure, and missing values helps in detecting any inconsistencies, errors, or gaps that could influence subsequent analyses. **Schema:**root\|-- company: string (nullable = true)\|-- link_id: string (nullable = true)\|-- created_utc: timestamp (nullable = true)\|-- body: string (nullable = true)\|-- is_tech: boolean (nullable = true)\|-- is_asking_for_help: boolean (nullable = true)\|-- is_asking_a\_question: boolean (nullable = true)\|-- is_FAANG: boolean (nullable = true)\|-- company_mentions: array (nullable = true)\| \|-- element: string (containsNull = true)\|-- isSubmission: boolean (nullable = false)\|-- role_type: string (nullable = true)\|-- average_yearly_compensation: double (nullable = true)\|-- average_years_experience: double (nullable = true)\|-- average_years_at_company: double (nullable = true)\|-- average_base_salary: double (nullable = true)\|-- average_stock_grant_value: double (nullable = true)\|-- average_bonus: double (nullable = true)```{python}#| eval: False# Print number of rowsmerged_df.count()```**Number of Rows:** 128339```{python}#| eval: False# Check for nullsmerged_df.select([count(when(col(c).isNull(), c)).alias(c) for c in merged_df.columns]).show()```**Null Count by Column:**| column | number of nulls ||-----------------------------|-----------------|| company | 8111 || body | 8111 || is_tech | 8111 || is_asking_for_help | 8111 || is_asking_a\_question | 8111 || is_FAANG | 934 || company_mentions | 934 || isSubmission | 934 || role_type | 934 || average_yearly_compensation | 934 || average_years_experience | 934 |Most of the company salary information is null in the data set after the merge, which is expected. Many subreddits mention no companies at all, some mention multiple, and some probably have mentioned companies not listed in the external data set. For the visualizations below, the nulls were removed to create a smaller, less sparse data set.#### **TOPIC 4: MARKET SALARY TREND ANALYSIS***Goal:* Connect salary information on various firms with the firms discussed in the Reddit submissions and comments. Identify the firms that offer the highest salaries and contrast them with the firms that are discussed most frequently in the context of job hunting and interviewing. Also devote particular attention to the firms represented by the FAANG acronym to build off prior examination of these firms from the EDA stage.Below are two bar plots showing the distribution of submission counts and comment counts by company. Nulls, "Other", and "Multiple" tagged rows were removed to just isolate the submissions and comments that mention one company specifically. Abnormal company names such as "Here" and "Test" were removed as well. Additionally, company counts with **less than 5** occurrences were removed to make sure the plot did not get too cluttered and unreadable.```{python}#| eval: False# Separate df into submissions and commentsfiltered_df = df.filter(df['company'].isNotNull()) # take out Nullssubmissions = filtered_df.filter(filtered_df.isSubmission ==True)comments = filtered_df.filter(filtered_df.isSubmission ==False)# Get the frequency of posts and comments by companysubmission_freqs = submissions.groupBy('company').count().orderBy('company')comments_freqs = comments.groupBy('company').count().orderBy('company')# Convert counts to pandassubmission_freqs = submission_freqs.toPandas()comments_freqs = comments_freqs.toPandas()# Filter out "Other" and "None" and "Multiple" to just get individual companiesexclude = ['Other', 'None', 'Multiple', 'Test', 'Here']submission_freqs = submission_freqs[~submission_freqs['company'].isin(exclude)]comments_freqs = comments_freqs[~comments_freqs['company'].isin(exclude)]# Filter out companies with small countssubmission_freqs = submission_freqs[submission_freqs['count'] >5]comments_freqs = comments_freqs[comments_freqs['count'] >5]# Plottingplt.figure(figsize = (60, 60))submission_freqs = submission_freqs.sort_values(by ='count', ascending =True)comments_freqs = comments_freqs.sort_values(by ='count', ascending =True)plt.subplot(1, 2, 1)bars = plt.barh(submission_freqs['company'].astype(str), submission_freqs['count'].astype(int), color ='#251279')plt.xlabel('No. of Submissions', fontsize =60)plt.tick_params(axis ='x', which ='major', labelsize =50) plt.tick_params(axis ='y', which ='major', labelsize =50) plt.title('Number of Submissions by Company', fontsize =60)plt.bar_label(bars, labels = submission_freqs['count'].astype(int), padding =3, fontsize =50)plt.subplot(1, 2, 2)bars = plt.barh(comments_freqs['company'].astype(str), comments_freqs['count'].astype(int), color ='#40B389')plt.xlabel('No. of Comments', fontsize =60)plt.tick_params(axis ='x', which ='major', labelsize =50) plt.tick_params(axis ='y', which ='major', labelsize =50) plt.title('Number of Comments by Company', fontsize =60)plt.bar_label(bars, labels = comments_freqs['count'].astype(int), padding =3, fontsize =50)plt.figtext(0.05, -0.02, 'Note: Companies with less than 5 mentions are not included. Additionally, posts mentioning multiple or "Other" companies are not included.', fontsize =50, color='black')plt.tight_layout()# Save figureplt.savefig('../../website-source/images/submissions_comments_by_company.png', dpi =300)plt.show()```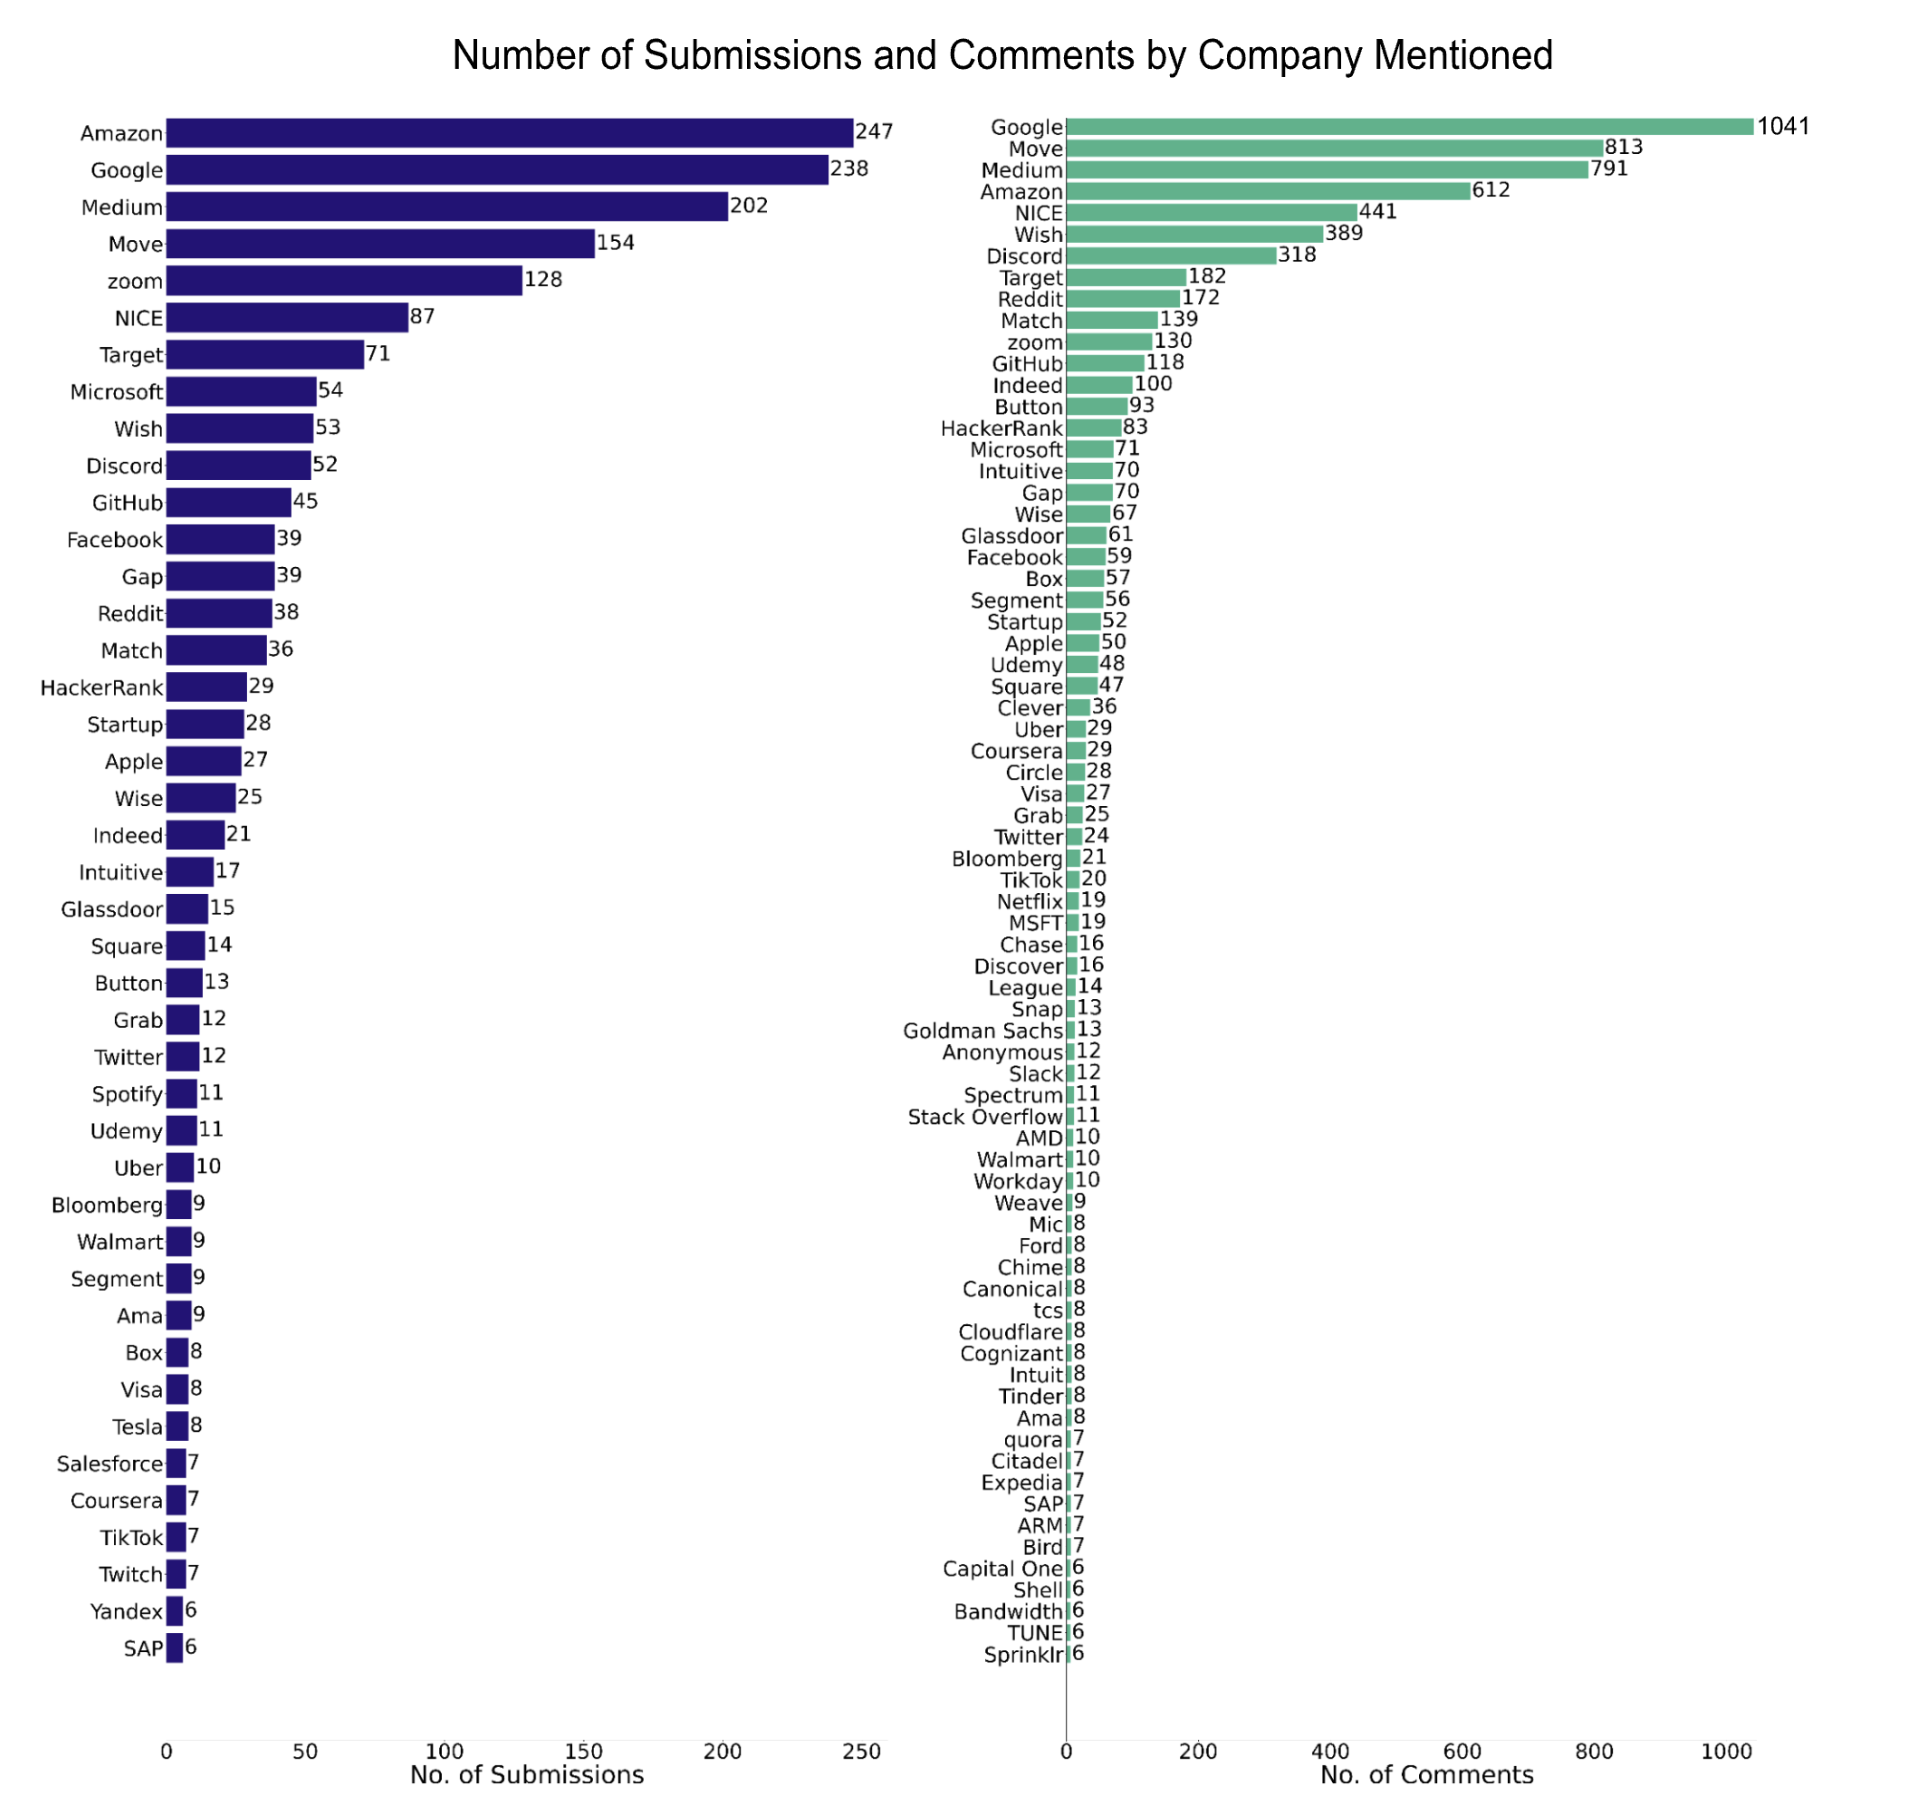{width="1150" height="1300"}As expected, Amazon and Google are the clear front-runners, surpassing other "FAANG" companies like Apple, Netflix, and Facebook. Medium is an interesting front-runner as well. Medium provides a lot of informative articles and code samples, so this might explain the reason for the high count of submissions and comments mentioning Medium.##### Top 20 Companies Mentioned with Compensation ComparisonBelow are the total mention counts for the top twenty companies.```{python}#| eval: Falseexclude = ['Other', 'None', 'Multiple', 'Test', 'Here']filtered_df = filtered_df[~filtered_df['company'].isin(exclude)]company_counts = filtered_df.groupBy('company').count()top_20_companies = company_counts.orderBy(F.col('count').desc()).limit(20)top_20_companies.show()```| company | count ||------------|-------|| Google | 1279 || Medium | 993 || Move | 967 || Amazon | 859 || NICE | 528 || Wish | 442 || Discord | 370 || zoom | 258 || Target | 253 || Reddit | 210 || Match | 175 || GitHub | 163 || Microsoft | 125 || Indeed | 121 || HackerRank | 112 || Gap | 109 || Button | 106 || Facebook | 98 || Wise | 92 || Intuitive | 87 |With this list of top twenty companies, the compensation metrics can be compared to see if any possible relationships arrive.```{python}#| eval: False# Aggregate data by company and calculate the mean for each metricdata_by_company = tech_df.groupby('company')[column_list].mean().reset_index()company_list = ["Google", "Medium", "Move", "Amazon", "NICE", "Wish", "Discord", "zoom", "Target", "Reddit", "Match", "GitHub", "Microsoft", "Indeed", "HackerRank", "Gap", "Button", "Facebook", "Wise", "Intuitive"]data_by_company["top10"] = data_by_company["company"].isin(company_list)top20 = data_by_company[data_by_company["top10"] ==True]ordered_top20 = {"average_yearly_compensation": list(top20.sort_values('average_yearly_compensation', ascending =False)['company']),"average_years_experience": list(top20.sort_values('average_years_experience', ascending =False)['company']),"average_years_at_company": list(top20.sort_values('average_years_at_company', ascending =False)['company']),"average_base_salary": list(top20.sort_values('average_base_salary', ascending =False)['company']),"average_stock_grant_value": list(top20.sort_values('average_stock_grant_value', ascending =False)['company']),"average_bonus": list(top20.sort_values('average_bonus', ascending =False)['company'])}# Create bar plots for each metricbar_charts = []for i inrange(len(title_list)): chart = alt.Chart(top20).mark_bar().encode( x = alt.X('company', title ='Company', sort = ordered_top20[column_list[i]]), y = alt.Y(column_list[i], title = x_axis_list[i]), color = alt.ColorValue(color_list[i]) ).properties( title =f"{title_list[i]} for Top 10 Mentioned Companies", width =400, height =220 ) bar_charts.append(chart)# Concatenate bar charts in a grid layoutfinal_bars = alt.vconcat( alt.hconcat(bar_charts[0], bar_charts[1]), alt.hconcat(bar_charts[2], bar_charts[3]), alt.hconcat(bar_charts[4], bar_charts[5]))```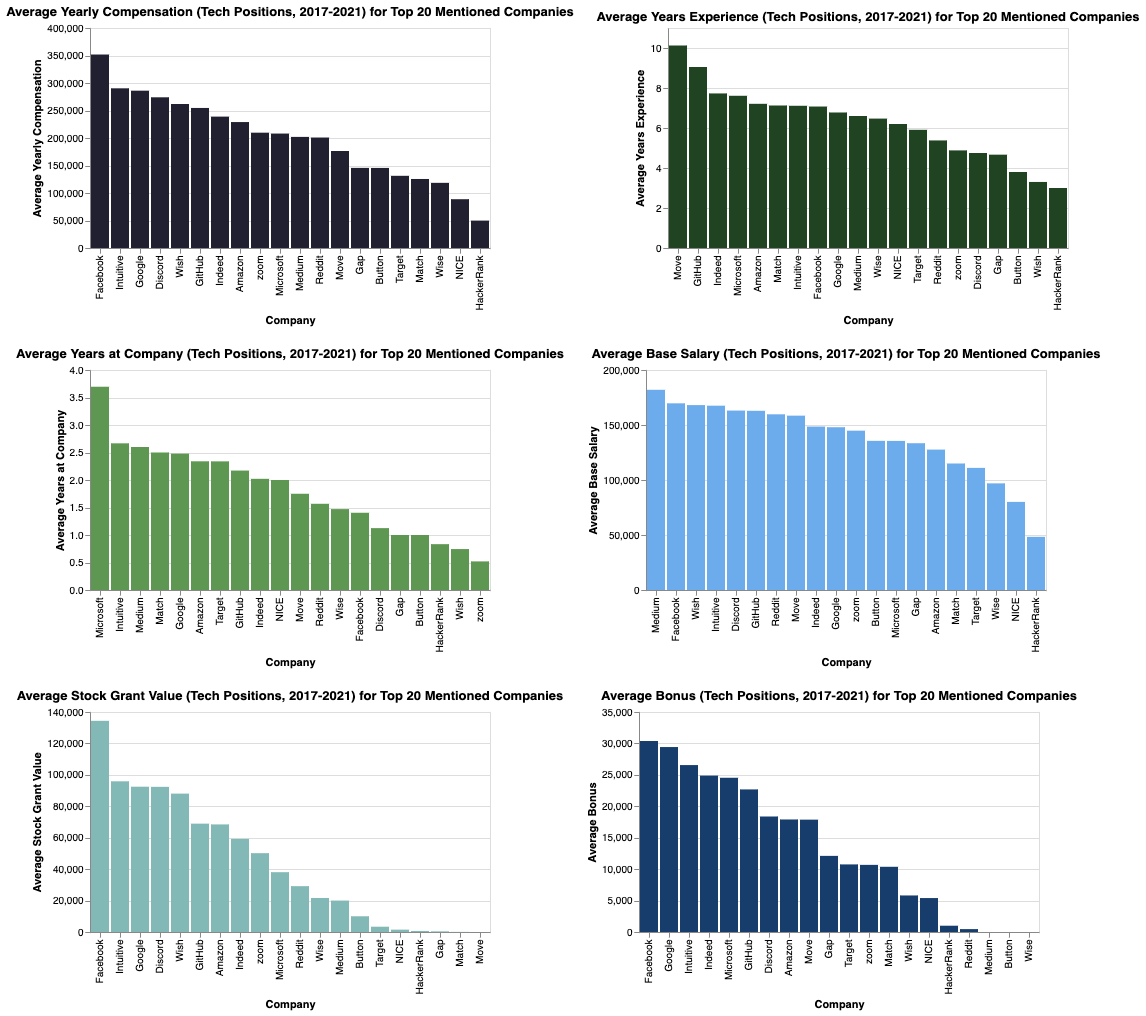{width="1150" height="1100"}FAANG companies like Facebook, Amazon and Google tend to be in the top half of the top twenty most mentioned companies regarding these compensation metrics. Overall, the charts suggest that there is a mixture of FAANG and non-FAANG companies that offer high compensation. It is interesting to see that companies with the highest compensation, do not necessarily observe the most years of experience or years at the compnay suggesting other factors play a role in compensation packages. The plot also shows variability in how long employees stay with these companies, which implies that factors other than compensation may influence tenure.### 2) Conducting Natural Language Processing Work#### **Topic 5: NLP Trends for Reddit Interview Content***Goal:* Identify topics within the posts/comments of the interview subreddits to uncover general themes for students to study further. This can highlight what types of subject matter are being discussed the most, whether coding topics or behavioral questions.From a technical perspective, this portion of the analysis begins with identifying the most common words across the dataset, using techniques such as tokenization, stop words removal, and word count aggregation. Next, the analysis explores the distribution of text lengths, offering a statistical overview of the dataset's text size. The third step involved identifying important words using Term Frequency-Inverse Document Frequency (TF-IDF), a method that highlights words that are unique to specific documents within the corpus. Transforming of text data using multiple NLP techniques like URL removal, tokenization, normalization, and stemming created a cleaner version of the dataset for improved text analysis. The creation of dummy variables based on regex patterns enables the categorization of texts into different technical domains such as programming languages and coding libraries.From a business perspective, the technical analysis in this section accomplishes goals such as insight into key topics and trends as well as data-driven decision making. By identifying the most common words and important terms (via TF-IDF), the analysis uncovers the main themes and topics prevalent in the dataset. This can be crucial for job seekers in understanding prevalent interview trends or job seeker concerns. ##### Most Common Words OverallThe table below shows that the most common words table shows the terms, "leetcode" and "questions" which might be helpful in steering job applicants to focus their study efforts on this subject. ```{python}#| eval: Falsefrom pyspark.sql import SparkSessionfrom pyspark.sql.functions import length, explode, splitfrom pyspark.ml.feature import Tokenizer, StopWordsRemover, CountVectorizer, IDFfrom pyspark.sql.functions import colimport matplotlib.pyplot as plt# tokenize tokenizer = Tokenizer(inputCol="body", outputCol="words")df_words = tokenizer.transform(df)# remove stop words remover = StopWordsRemover(inputCol="words", outputCol="filtered_words")df_filtered = remover.transform(df_words)# explode the array into wordsdf_exploded = df_filtered.select(explode(col("filtered_words")).alias("word"))# filter out single character wordsdf_filtered_single_char = df_exploded.filter(length(col("word")) >1)# count df_word_count = df_filtered_single_char.groupBy("word").count()df_word_count.orderBy(col("count").desc()).show()```+--------------+------------+| ``` | count || word | || ``` | |+==============+============+| interview\ | 22631\ || like\ | 18719\ || get\ | 17015\ || questions\ | 13818\ || time\ | 13330\ || one\ | 13245\ || good\ | 12364\ || know\ | 11881\ || job\ | 11718\ || leetcode\ | 11557\ || think\ | 11144\ || also\ | 9331\ || want\ | 9048\ || really\ | 8620\ || need\ | 8564\ || problems\ | 8560\ || \[deleted\]\ | 8453\ || problem\ | 8444\ || work\ | 8017\ || first\ | 7521\ |+--------------+------------+##### Distribution of Text LengthsThese statistics confirm that the dataset contains a significant amount of posts/comments with an average length of about 234 characters. The standard deviation is quite high, indicating a large variability in the length of texts. ```{python}#| eval: False# calc length of each textdf = df.withColumn("text_length", length(df["body"]))df.describe("text_length").show()```+---------------+---------------------+| summary | text_length |+===============+=====================+| count\ | 128339\ || mean\ | 233.57049688715043\ || stddev\ | 480.0254950591896\ || min\ | 1\ || max\ | 38271\ |+---------------+---------------------+##### Important Words According to TF-IDFThe provided list of words and their TF-IDF scores provides insight into the topics and concerns that are most prominent in the Reddit posts and comments surround technical interviews. The most important term, 'spaced', is an unusual observation as it does not offer clarity as to why it would be a key concept in technical interview Reddits. Other terms such as 'interview', 'simple', and 'subscribe' are more in line with expectations as they indicate a focus on interview processes, seeking simple advice or interview resources, and potentially encouraged to follow or subscribe to threads or channels for updates on interview strategies. The presence of emotionally charged words like 'ugh' and 'crushing' may reflect the anxiety and difficulty of technical interview preparation.```{python}#| eval: False# term frequencydf_sampled = df_filtered.sample(False, 0.1)cv = CountVectorizer(inputCol="filtered_words", outputCol="raw_features")cv_model = cv.fit(df_sampled)df_featurized = cv_model.transform(df_sampled)# idfidf = IDF(inputCol="raw_features", outputCol="features")idf_model = idf.fit(df_featurized)df_rescaled = idf_model.transform(df_featurized)tf_idf_pandas_df = df_rescaled.select("features").toPandas()def extract_top_words(features, vocabulary, n_top_words=3): dense_vector = features.toArray() top_indices = dense_vector.argsort()[-n_top_words:][::-1] top_words = [(vocabulary[i], dense_vector[i]) for i in top_indices]return top_wordsvocabulary = cv_model.vocabulary# extract top words for each rown_top_words =1top_words_list = [extract_top_words(row['features'], vocabulary, n_top_words) for index, row in tf_idf_pandas_df.iterrows()]top_words_list[35:45]```Below is a list of tuples, each containing a word and its corresponding aggregated TF-IDF score.\[\[('spaced', 13.378421024061316)\],\\[('bud.', 8.768652053710493)\],\\[('pill.', 8.768652053710493)\],\\[('interview', 8.768652053710493)\],\\[('simple', 9.794902085605205)\],\\[('ugh', 7.670039765042384)\],\\[('rated', 7.670039765042384)\],\\[('crushing', 7.2645746569342196)\],\\[('\[deleted\]', 2.7537151504173694)\],\\[('subscribe', 7.159214141276394)\]\]##### Cleaning the Text Using 5+ NLP TechniquesIn this section, more detailed text cleaning techniques are put in place. The following code used Spark NLP methods such as tokenizing, stemming, removing punctuation, removing stop words, and more to clean the Reddit content. ```{python}#| eval: False# remove https links def remove_https_links(text):return re.sub(r'https?:\/\/\S+', '', text)remove_https_links_udf = udf(remove_https_links, StringType())df_no_url = df.withColumn("body_no_url", remove_https_links_udf("body"))df_no_url.select('body_no_url').show(4, truncate=False)# set up spark pipelinedocument_assembler = DocumentAssembler() \ .setInputCol("body_no_url") \ .setOutputCol("document")# tokenizetokenizer = Tokenizer() \ .setInputCols(["document"]) \ .setOutputCol("token")# normalize words to remove unnecessary punctuationnormalizer = Normalizer() \ .setInputCols(["token"]) \ .setOutputCol("normalized") \ .setLowercase(True) \ .setCleanupPatterns(["[^A-Za-z0-9 ]"]) # remove stop wordsstopwords_cleaner = StopWordsCleaner() \ .setInputCols(["normalized"]) \ .setOutputCol("cleanTokens") \ .setCaseSensitive(False)# stem wordsstemmer = Stemmer() \ .setInputCols(["cleanTokens"]) \ .setOutputCol("stem")# sentence_detector = SentenceDetector() \# .setInputCols(["cleanTokens"]) \# .setOutputCol("sentence")finisher = Finisher() \ .setInputCols(["cleanTokens"]) \ .setOutputCols(["finished_ngrams"]) \ .setOutputAsArray(False) \ .setCleanAnnotations(True)# Define the pipelinepipeline = Pipeline().setStages([ document_assembler, tokenizer, normalizer, stopwords_cleaner, stemmer, finisher])# run the pipeline model = pipeline.fit(df_no_url)clean_df = model.transform(df_no_url)from pyspark.sql.functions import regexp_replaceclean_df_nlp = clean_df.withColumn("clean_body", regexp_replace("finished_ngrams", "@", " "))clean_df_nlp.select("clean_body").show(5,truncate=False)```**Preview of posts and comments after cleaning:**+------------------------------------------------------------------------------------------------------------------------------------------------------------------------------------------------------------------------+| clean_body |+------------------------------------------------------------------------------------------------------------------------------------------------------------------------------------------------------------------------+| messaging 21 days 20230128 065831 utc remind link click link send pm also reminded reduce spam parent commenter delete message hide others info reminders sorry didnt see thank howd get change anything prep strategy |+------------------------------------------------------------------------------------------------------------------------------------------------------------------------------------------------------------------------+#### **Topic 6: Identification of Most Important Skills for Technical Interviewing***Goal:* Hone in on the most important and most frequent skills discussed on Reddit for technical interviews. Explore mention frequency of various programming languages, tools, and libraries. Also identify the most important stages of the technical interview.##### Creating New Dummy VariablesTo focus on topics such as programming languages, tools, and libraries, new variables are required. ```{python}#| eval: Falsefrom pyspark.sql.functions import regexp_extract, collanguage_pattern =r'(?i)(Python|SQL|SparkSQL|PySpark|Java|Scala|Julia|MATLAB|C\+\+|SAS|NoSQL|Hadoop|Hive|BigQuery)'library_pattern =r'(?i)(Pandas|Tensorflow|Pytorch|sklearn|Keras|NumPy|SciPy|Matplotlib|Seaborn|Dask|NLTK|Gensim|Scrapy|Statsmodels|XGBoost|LightGBM|Jupyter|FastAI|Spacy|Theano|Yolo)'tool_pattern =r'(?i)(Tableau|Shiny|Sagemaker|Azure|PowerBI|Databricks|Alteryx|Qlik|Looker|Google Cloud Platform|AWS|Dataiku|Docker|Kubernetes|Airflow|ML)'stage_pattern =r'(?i)(initial screening|technical round|HR round|final round|offer stage)'clean_df_nlp_var = clean_df_nlp.withColumn("programming_language_mentioned", (regexp_extract(col("clean_body"), language_pattern, 0) !='').cast('int'))clean_df_nlp_var = clean_df_nlp_var.withColumn("coding_library_mentioned", (regexp_extract(col("clean_body"), library_pattern, 0) !='').cast('int'))clean_df_nlp_var = clean_df_nlp_var.withColumn("ds_tool_mentioned", (regexp_extract(col("clean_body"), tool_pattern, 0) !='').cast('int'))clean_df_nlp_var = clean_df_nlp_var.withColumn("interview_stage_mentioned", (regexp_extract(col("clean_body"), stage_pattern, 0) !='').cast('int'))from pyspark.sql.functions import col, count, mean, sumsummary_stats = clean_df_nlp_var.agg( count("*").alias("total_count"),sum(col("programming_language_mentioned")).alias("sum_programming_language_mentioned"),sum(col("coding_library_mentioned")).alias("sum_coding_library_mentioned"),sum(col("ds_tool_mentioned")).alias("sum_ds_tool_mentioned"),sum(col("interview_stage_mentioned")).alias("sum_interview_stage_mentioned"))summary_stats.show(truncate=False)```**Statistical summary table for regex patterns from new variables:**+-------------+------------------------------------+------------------------------+-----------------------+-------------------------------+| total_count | sum_programming_language_mentioned | sum_coding_library_mentioned | sum_ds_tool_mentioned | sum_interview_stage_mentioned |+-------------+------------------------------------+------------------------------+-----------------------+-------------------------------+| 128339 | 5188 | 53 | 1004 | 476 |+-------------+------------------------------------+------------------------------+-----------------------+-------------------------------+**Visualization for regex patterns from new variables:**The extraction and visualization of patterns through regex-based categorization, encompassing elements like programming languages and coding libraries, offers additional guidance. The sundial visualization, for example, highlights the prevalence of programming languages, especially Python, within the text. This observation can streamline a job applicant's study plan by emphasizing Python, thereby optimizing interview preparation and enhancing their chances of success. ```{python}#| eval: False# filter out row where no programming language is mentioneddf_w_languages = clean_df_nlp_var.filter(col("programming_language_mentioned")==1)df_w_libraries = clean_df_nlp_var.filter(col("coding_library_mentioned")==1)df_w_tools = clean_df_nlp_var.filter(col("ds_tool_mentioned")==1)df_w_stage = clean_df_nlp_var.filter(col("interview_stage_mentioned")==1)# write function to extract language frequency in each text def extract_pattern(pattern,text):return re.findall(pattern, text) # create udfextract_pattern_udf = udf(extract_pattern, ArrayType(StringType()))# add a column with the pattern to the DataFramesdf_w_languages = df_w_languages.withColumn("pattern", lit(language_pattern))df_w_libraries = df_w_libraries.withColumn("pattern", lit(library_pattern))df_w_tools = df_w_tools.withColumn("pattern", lit(tool_pattern))df_w_stage = df_w_stage.withColumn("pattern", lit(stage_pattern))# apply the UDF df_w_languages = df_w_languages.withColumn("mentioned_languages", extract_pattern_udf(col("pattern"), col("clean_body")))df_w_libraries = df_w_libraries.withColumn("mentioned_libraries", extract_pattern_udf(col("pattern"), col("clean_body")))df_w_tools = df_w_tools.withColumn("mentioned_tools", extract_pattern_udf(col("pattern"), col("clean_body")))df_w_stage = df_w_stage.withColumn("mentioned_stages", extract_pattern_udf(col("pattern"), col("clean_body")))# explode the mentioned languagesexploded_languages = df_w_languages.withColumn("language", explode(col("mentioned_languages")))exploded_libraries = df_w_libraries.withColumn("library", explode(col("mentioned_libraries")))exploded_tools = df_w_tools.withColumn("tool", explode(col("mentioned_tools")))exploded_stages = df_w_stage.withColumn("stage", explode(col("mentioned_stages")))# group by language and countlanguage_cts = exploded_languages.groupBy("language").count()library_cts = exploded_libraries.groupBy("library").count()tool_cts = exploded_tools.groupBy("tool").count()stage_cts = exploded_stages.groupBy("stage").count()# add col describing patternlanguage_cts = language_cts.withColumn("pattern_topic", lit("programming language"))library_cts = library_cts.withColumn("pattern_topic", lit("coding library"))tool_cts = tool_cts.withColumn("pattern_topic", lit("data science tool"))stage_cts = stage_cts.withColumn("pattern_topic", lit("interview stage"))language_cts = language_cts.withColumnRenamed("language", "pattern")library_cts = library_cts.withColumnRenamed("library", "pattern")tool_cts = tool_cts.withColumnRenamed("tool", "pattern")stage_cts = stage_cts.withColumnRenamed("stage", "pattern")# convert to pandas for future visualizationlanguage_cts_pd = language_cts.toPandas()library_cts_pd = library_cts.toPandas()tool_cts_pd = tool_cts.toPandas()stage_cts_pd = stage_cts.toPandas()# union pd dataframes for visualizations latercombined_cts_pd = pd.concat([language_cts_pd, library_cts_pd, tool_cts_pd, stage_cts_pd], ignore_index=True)# visualizecolor_map = {'programming language': '#163d6b', 'coding library': '#204321','data science tool': '#82B8B5' ,'interview stage' :'#5E9751'}fig = px.sunburst( combined_cts_pd, path=['pattern_topic', 'pattern'], values='count', color='pattern_topic', color_discrete_map=color_map, title='Distribution of RegEx Topic Patterns')fig.update_layout(width=650, height=650)fig.show()```<iframesrc="images/sundial.html"width="300%"height="600px"></iframe>### 3) Building a Sentiment Model#### **Topic 7: Sentiment Analysis of Interview Posts & Comments***Goal:* Observe the overall sentiment of posts and comments related to the filtered dataset that focuses on interviews. This will help identify how candidates are feeling about the interview process, which can draw insight into a specific employer or topic interview difficulty level.For the purpose of the sentiment analysis, spark jars packages and the John Snow Labs pagckage were used. The John Snow Labs package includes several pre-trained models. The one best suited for this analysis is the sentimentdl_use_twitter. The models consist of four parts. The first part, documentAssembler, takes as an input the text column (in this case 'body' column). The second part, the use part, has the Universal Sentence Encoder that utilizes the TenserFlow Hub use. The input of the second part is the output of the first documentAssembler part. Part three is the sentiment deep learning pretrained model that takes as the input the output of the second part and utilizes the John Snow Labs sentimentdl_use_twitter model with the English languge. This part outputs the sentiments for each row of the 'body' text column. The final part is the NLP Pipeline, which puts all the previous parts together, allowing the input of the data frame into the pipeline. The pipline runs through all the previously mentioned parts and produces a new sentiment column with three sentiment options - postive, neutral, negative. The last step in the sentiment analysis is transforming the output of the pipeline into a results dataframe.```{python}#| eval: False! pip install sparknlpimport jsonimport sparknlpimport numpy as npimport pandas as pdfrom sparknlp.base import*from pyspark.ml import Pipelinefrom sparknlp.annotator import*import pyspark.sql.functions as Ffrom pyspark.sql import SparkSessionimport sagemakerfrom sagemaker.spark.processing import PySparkProcessorfrom sparknlp.pretrained import PretrainedPipelinefrom pyspark.sql import SparkSessionimport sparknlpimport sagemakersess = sagemaker.Session()# Import pyspark and build Spark sessionfrom pyspark.sql import SparkSessionimport sparknlpfrom sparknlp.base import DocumentAssemblerfrom sparknlp.annotator import UniversalSentenceEncoder, SentimentDLModelfrom pyspark.ml import Pipeline# Initialize Spark session for Spark NLPspark = SparkSession.builder\ .appName("PySparkApp")\ .master("local[*]")\ .config("spark.driver.memory","16G")\ .config("spark.driver.maxResultSize", "0") \ .config("spark.kryoserializer.buffer.max", "2000M")\ .config("spark.jars.packages", "com.johnsnowlabs.nlp:spark-nlp_2.12:5.1.3,org.apache.hadoop:hadoop-aws:3.2.2")\ .config("fs.s3a.aws.credentials.provider", "com.amazonaws.auth.ContainerCredentialsProvider")\ .getOrCreate()%%timeimport sagemakersession = sagemaker.Session()#s3://sagemaker-us-east-1-131536150362/project/data_reformat_clean_nlp.parquet/bucket ="tm1450-project"output_prefix_data_submissions ="data_reformat_clean.parquet/"s3_path =f"s3a://{bucket}/{output_prefix_data_submissions}"#print(f"reading tagged data from {s3_path}")df = spark.read.parquet(s3_path, header=True)#print(f"shape of the submissions dataframe is {df.count():,}x{len(df.columns)}")# Define model names and pipeline componentsMODEL_NAME ='sentimentdl_use_twitter'documentAssembler = DocumentAssembler()\ .setInputCol("body")\ .setOutputCol("document")use = UniversalSentenceEncoder.pretrained(name="tfhub_use", lang="en")\ .setInputCols(["document"])\ .setOutputCol("sentence_embeddings")sentimentdl = SentimentDLModel.pretrained(name=MODEL_NAME, lang="en")\ .setInputCols(["sentence_embeddings"])\ .setOutputCol("sentiment")nlpPipeline = Pipeline( stages = [ documentAssembler, use, sentimentdl ])pipelineModel = nlpPipeline.fit(df)results = pipelineModel.transform(df)```**Schema:**root\\|-- link_id: string (nullable = true)\\|-- created_utc: timestamp (nullable = true)\\|-- body: string (nullable = true)\\|-- is_tech: boolean (nullable = true)\\|-- is_asking_for_help: boolean (nullable = true)\\|-- is_asking_a\_question: boolean (nullable = true)\\|-- is_FAANG: boolean (nullable = true)\\|-- isSubmission: boolean (nullable = true)\\|-- body_no_url: string (nullable = true)\\|-- finished_ngrams: string (nullable = true)\\|-- clean_body: string (nullable = true)\\|-- document: array (nullable = true)\\| \|-- element: struct (containsNull = true)\\| \| \|-- annotatorType: string (nullable = true)\\| \| \|-- begin: integer (nullable = false)\\| \| \|-- end: integer (nullable = false)\\| \| \|-- result: string (nullable = true)\\| \| \|-- metadata: map (nullable = true)\\| \| \| \|-- key: string\\| \| \| \|-- value: string (valueContainsNull = true)\\| \| \|-- embeddings: array (nullable = true)\\| \| \| \|-- element: float (containsNull = false)\\|-- sentence_embeddings: array (nullable = true)\\| \|-- element: struct (containsNull = true)\\| \| \|-- annotatorType: string (nullable = true)\\| \| \|-- begin: integer (nullable = false)\\| \| \|-- end: integer (nullable = false)\\| \| \|-- result: string (nullable = true)\\| \| \|-- metadata: map (nullable = true)\\| \| \| \|-- key: string\\| \| \| \|-- value: string (valueContainsNull = true)\\| \| \|-- embeddings: array (nullable = true)\\| \| \| \|-- element: float (containsNull = false)\\|-- sentiment: array (nullable = true)\\| \|-- element: struct (containsNull = true)\\| \| \|-- annotatorType: string (nullable = true)\\| \| \|-- begin: integer (nullable = false)\\| \| \|-- end: integer (nullable = false)\\| \| \|-- result: string (nullable = true)\\| \| \|-- metadata: map (nullable = true)\\| \| \| \|-- key: string\\| \| \| \|-- value: string (valueContainsNull = true)\\| \| \|-- embeddings: array (nullable = true)\\| \| \| \|-- element: float (containsNull = false)\#### Tables of Summary StatisticsBelow is a table that provides a glimpse at the data in terms of how the sentiment analysis created a new variable that allows further analysis, such as what does sentiment look like for the entire dataset, or for sepcific attributes such as posts/comments that focus on asking for help or FAANG companies.```{python}#| eval: Falsefrom pyspark.sql.functions import explode, col# Explode the sentiment array and extract the result fieldresults = results.withColumn('sentiment', F.explode('sentiment'))results = results.withColumn('sentiment', F.col('sentiment.result'))# Selecting columns for the final DataFramefinal_data = results.select('is_tech', 'is_asking_for_help', 'is_asking_a_question', 'is_FAANG', 'clean_body', 'sentiment')# Persist and show the DataFramefinal_data.persist()final_data.show()```+----------+--------------------+-----------------------+----------+-----------------------+-----------+| is_tech | is_asking_for_help | is_asking_a\_question | is_FAANG | ``` | sentiment || | | | | clean_body | || | | | | ``` | |+==========+====================+=======================+==========+=======================+===========+| true\ | false\ | false\ | false\ | \ | neutral\ || true\ | false\ | true\ | false\ | messaging 21 days...\ | positive\ || false\ | false\ | false\ | false\ | sorry didnt see t...\ | positive\ || false\ | false\ | true\ | false\ | howd get\ | positive\ || false\ | false\ | true\ | false\ | change anything p...\ | positive\ || false\ | false\ | false\ | false\ | one 180 question ...\ | negative\ || false\ | true\ | true\ | true\ | approach solving ...\ | positive\ || false\ | false\ | false\ | false\ | places wanting pe...\ | positive\ || false\ | true\ | true\ | false\ | principles mean s...\ | positive\ || false\ | false\ | false\ | false\ | interested\ | positive\ || true\ | false\ | false\ | false\ | thanks exactly fo...\ | positive\ || false\ | false\ | false\ | false\ | okay thats good i...\ | positive\ || false\ | false\ | false\ | false\ | wait take back sa...\ | neutral\ || true\ | false\ | false\ | false\ | map contains inte...\ | positive\ || false\ | false\ | false\ | false\ | practice together\ | positive\ || false\ | false\ | false\ | false\ | \ | positive\ || true\ | true\ | true\ | false\ | gtdo think solvin...\ | positive\ || false\ | false\ | false\ | false\ | bro need work sof...\ | negative\ || false\ | false\ | false\ | false\ | settle sugarlips\ | positive\ || false\ | false\ | false\ | false\ | 25 years almost\ | positive\ |+----------+--------------------+-----------------------+----------+-----------------------+-----------+#### Full Dataframe Sentiment CountsThe large number of positive sentiments suggests that although there is a strong presence of positive discourse, there is also a substantial number of negative experiences or thoughts being shared. ```{python}#| eval: Falsesentiment_counts = final_data.groupBy("sentiment").count()sentiment_counts.show()```+-----------+---------+| sentiment | count |+===========+=========+| positive\ | 81780\ || neutral\ | 4164\ || negative\ | 42395\ |+-----------+---------+##### Sentiment Counts for is_tech ColumnThe is_tech column represents a subset of the data where the focus is on technical aspects of interviews. The sentiment analysis summary for this subset of data shows positive sentiments far outnumber the negatives, suggesting that discussions in this category are generally more positive. This is surprising as the technical aspect of interviews are usually the most stressful so this provides a bit of hope to those starting the long road of technical interview preparation. ```{python}#| eval: Falsetech_data = final_data.filter(col('is_tech') ==True)sentiment_counts = tech_data.groupBy('sentiment').count()print('Sentiment Counts for is_tech Column')sentiment_counts.show()```+-----------+---------+| sentiment | count |+===========+=========+| positive\ | 20776\ || neutral\ | 979\ || negative\ | 7629\ |+-----------+---------+##### Sentiment Counts for is_asking_for_help ColumnThe is_asking_for_help column represents a data subset focusing on posts where individuals are seeking assistance. Positive sentiment is almost double the negative sentiment, which may signify a supportive environment for those asking for help, again providing hope for those starting the challenge of preparing for technical interviews. ```{python}#| eval: Falsehelp_data = final_data.filter(col('is_asking_for_help') ==True)sentiment_counts = help_data.groupBy('sentiment').count()print('Sentiment Counts for is_asking_for_help Column')sentiment_counts.show()```+-----------+---------+| sentiment | count |+===========+=========+| positive\ | 9839\ || neutral\ | 346\ || negative\ | 4602\ |+-----------+---------+##### Sentiment Counts for is_asking_a\_question ColumnThe table below shows a higher number of positive sentiments than negative ones for posts/comments that ask a question. This might suggest that the Reddit community is usually supportive when individuals ask questions, creating an environment for information exchange and learning. Having knowledge of this may encourage new users seeking advice for technical interview to be less afraid in asking questions. ```{python}#| eval: False#| ```+-----------+---------+| sentiment | count |+===========+=========+| positive\ | 20014\ || neutral\ | 867\ || negative\ | 13028\ |+-----------+---------+##### Sentiment Counts for is_FAANG ColumnThe is_FAANG posts/comments discussing interviews at FAANG companies (Facebook, Amazon, Apple, Netflix, Google), show that sentiment is more positive than negative. This indicates that conversations around interviews at these top tech companies are more positive, which could be due to successful interview experiences or helpful insights posted by users who have interviewed with these companies.```{python}#| eval: Falsequestion_data = final_data.filter(col('is_asking_a_question') ==True)sentiment_counts = question_data.groupBy('sentiment').count()print('Sentiment Counts for is_asking_a_question Column')sentiment_counts.show()```+-----------+---------+| sentiment | count |+===========+=========+| positive\ | 3488\ || neutral\ | 171\ || negative\ | 1554\ |+-----------+---------+##### Plot of Summary StatisticsThe plot below displays a more succinct summary of the count of posts (submissions and comments) for each sentiment classification broken down by post type. Again, the text content types include:1) A post asking for help2) A post asking a question3) A post mentioning a FAANG company4) A technical postThese topics were found using Regex as described above and in previous parts of the website. In general, for the full dataset, there are mainly postive sentiments for submissions and comments. The positive submissions and comments are almost double in size as compared to the submissions and comments with negative sentiment. For texts where is_tech column is true the ratio of postive to negative sentiments is higher than for any other column. The opposite is true for the rows where is_asking_for_help column is true. The number of neutral sentiments is the lowest in the whole dataset and as well in relation to the other sentiments for all the options where column_name = True.```{python}#| eval: Falseimport pyspark.sql.functions as Fimport pandas as pd# Get sentiment counts for submissions/comments that ask for helpdf_tech_counts = df\ .filter(F.col('is_tech'))\ .groupBy('sentiment')\ .count()\ .withColumn('category', F.lit('Technical'))# Get sentiment counts for submissions/comments that ask for helpdf_help_counts = df\ .filter(F.col('is_asking_for_help'))\ .groupBy('sentiment')\ .count()\ .withColumn('category', F.lit('Asking for help'))# Get sentiment counts for submissions/comments that ask a questiondf_question_counts = df\ .filter(F.col('is_asking_a_question'))\ .groupBy('sentiment')\ .count()\ .withColumn('category', F.lit('Asking question'))# Get sentiment counts for submissions/comments that mention a FAANG# companydf_FAANG_counts = df\ .filter(F.col('is_FAANG'))\ .groupBy('sentiment')\ .count()\ .withColumn('category', F.lit('Mentions FAANG'))# Concatenate the count dfs together and convert to pandasdf_count_summary = df_tech_counts\ .union(df_help_counts)\ .union(df_question_counts)\ .union(df_FAANG_counts)\ .toPandas()# Pivot dataframedf_plot = df_count_summary.pivot(index='category', columns='sentiment', values='count').reset_index()# Code referenced: https://matplotlib.org/stable/gallery/lines_bars_and_markers/bar_colors.htmlimport matplotlib.pyplot as pltimport numpy as npx = np.arange(len(df_plot['category'])) # the label locationswidth =0.25# the width of the barsmultiplier =0color_dict = {'negative': '#251279','neutral': '#6CACED','positive': '#5E9751'}fig, ax = plt.subplots(layout='constrained')# Cycle through each sentiment label (negative, neutral, positive)for sentiment_label in df_plot.columns:# Skip the category columnif sentiment_label !='category': offset = width * multiplier rects = ax.bar( x + offset, df_plot[sentiment_label], width, label=sentiment_label.title(), color=color_dict[sentiment_label] ) ax.bar_label(rects, padding=3) multiplier +=1# Add some text for labels, title and custom x-axis tick labels, etc.ax.set_ylabel('Number of Submissions/Comments')ax.set_title('Distribution of Sentiment')ax.set_xticks(x + width, df_plot['category'])ax.legend(loc='upper left')ax.set_ylim(0, 22000)plt.savefig('../../website-source/images/sentiment_dist.png', dpi=300)plt.show()```<imgsrc="images/sentiment_dist.png"style="width: 75%; height: auto;"/>