The following page is dedicated solely to the different exploratory data analytics methods performed to gain further insight into the Reddit data, specifically the Reddits relating to interviews and technical discussions around job applications and technical career preparation. The page is broken down into the following sections:
Data Preparation (broken into eight different sub-sections)
Summary Tables
Visualizations (broken down by three EDA topics)
Additional Data Set
Data Preparation
1) Data Filtering
Before exploring the topics above, the data needs to be filtered for the subreddit topics of interest and cleaned appropriately. This section describes and shows how the data was cleaned and prepared. The following plot illustrates the distribution of submissions and comments across the different subreddits that data was pulled from. These included:
leetcode
interviewpreparations
codinginterview
InterviewTips
csinterviewproblems
interviews
big_tech_interviews
The most prominent subreddit is clearly leetcode, which shows that the dataset is largely concerned with technical/coding interview experiences. However, the second-most prominent subreddit is interviews, which introduces some necessary discussion of behavioral/professional interview experiences into the dataset.
Code
# Subreddit breakdownimport pyspark.sql.functions as Fimport pandas as pdimport datetime# Combine submissions and commentssubmissions_subreddits = submissions.select('subreddit')comments_subreddits = comments.select('subreddit')subreddits = submissions_subreddits.union(comments_subreddits).cache()# Count total submissions and comments by subredditsubreddit_counts = subreddits.groupBy('subreddit').count().cache()# Convert to pandas dataframeimport pandas as pdsubreddit_counts_pd = subreddit_counts.toPandas()# subreddit_counts.count()import matplotlib.pyplot as pltplt.figure(figsize=(10, 6))# Plot the data using matplotlibfig, ax = plt.subplots(dpi=300)bars = ax.bar( subreddit_counts_pd['subreddit'], subreddit_counts_pd['count'], color=['#40B389', '#4A80EB', '#5E9751', '#163D6B'])# Add title and labels to the plotax.set_title('Breakdown of Comment and Submission Counts by Subreddit')ax.set_xlabel('Subreddit')ax.set_ylabel('Comment and Submission Count')ax.xaxis.set_tick_params(rotation=45)# Annotate the height of each barfor bar in bars: height = bar.get_height() ax.annotate('{}'.format(height), xy=(bar.get_x() + bar.get_width() /2, height), xytext=(0, 1), # 3 points vertical offset textcoords="offset points", ha='center', va='bottom')plt.savefig('../data/plots/subreddit_breakdown.png', dpi=300)# Show the plotplt.show()
2) Data Cleaning
This section covers code used to clean and organize the Reddit posts and comments for further analysis. The data is then broken out into tables, highlighting key columns such as IDs, subreddit information, and textual content. This process of cleaning involves preparing the data in a way that makes it more accessible and suitable for future in-depth analysis with regards to online social commentary on technical interviews.
Code
# DATA CLEANINGimport sagemakerfrom sagemaker.spark.processing import PySparkProcessorimport time%%timesession = sagemaker.Session()bucket = session.default_bucket()output_prefix_data_submissions =f"project/submissions/yyyy=*"s3_path =f"s3a://{bucket}/{output_prefix_data_submissions}"#print(f"reading submissions from {s3_path}")submissions = spark.read.parquet(s3_path, header=True)print(f"Shape of the submissions dataframe is {submissions.count():,}x{len(submissions.columns)}")%%timeoutput_prefix_data_comments ="project/comments/yyyy=*"s3_path =f"s3a://{bucket}/{output_prefix_data_comments}"#print(f"reading comments from {s3_path}")comments = spark.read.parquet(s3_path, header=True)print(f"Shape of the comments dataframe is {comments.count():,}x{len(comments.columns)}")from pyspark.sql.functions import concat, lit, lower, col, when, array# Getting only the columns we need for cubmissions and commentssubmissions_subset_col = submissions.select("id", "subreddit", "subreddit_id", "title", "selftext", col("created_utc").alias("created_utc_submission"), "num_comments")comments_subset_col = comments.select("link_id", "body", col("created_utc").alias("created_utc_comment"))# Making an "searchable_text" column for taggingsubmissions_subset_col = submissions_subset_col.withColumn("searchable_text", concat(submissions_subset_col["title"], lit(" "), submissions_subset_col["selftext"]))# Regex 1keywords_is_tech = ["tech", "technology", "code", "coding", "computer", "data", "python","java", "javascript", "sql", "database", "statistics", "azure", "cloud computing", "progamming", "leetcode", "saas", "faang"]pattern ="(?i)"+"|(?i)".join(keywords_is_tech)comments_tagged = comments_subset_col .withColumn('is_tech_comments', col('body').rlike(pattern)) .cache()submissions_tagged = submissions_subset_col .withColumn('is_tech_submissions', col('searchable_text').rlike(pattern))# Regex 2keywords_help = ["help me", "struggle", "struggling", "anyone", "advice", "tips", "help"]pattern ="(?i)"+"|(?i)".join(keywords_help)submissions_tagged = submissions_tagged .withColumn('is_asking_for_help_submissions', col('searchable_text').rlike(pattern))comments_tagged = comments_tagged .withColumn('is_asking_for_help_comments', col('body').rlike(pattern)) .cache()# Regex 3submissions_tagged = submissions_tagged .withColumn('is_asking_a_question_submissions', col('searchable_text').rlike(r'(?)+'))comments_tagged = comments_tagged .withColumn('is_asking_a_question_comments', col('body').rlike(r'(?)+')) .cache()# Regex 4keywords_faang = ["facebook", "amazon", "apple", "netflix", "google"]pattern ="(?i)"+"|(?i)".join(keywords_faang)submissions_tagged = submissions_tagged .withColumn('is_FAANG_submissions', col('searchable_text').rlike(pattern)) .cache()comments_tagged = comments_tagged .withColumn('is_FAANG_comments', col('body').rlike(pattern)) .cache()# Join comments and submissionsjoined_subset = comments_new_id.join(submissions_tagged, comments_new_id['link_id'] == submissions_tagged['id'], 'outer')
3) Data Tagging: Regex Searches
The following section incorporates Regex searches to create new information in the data - particulary attributes the inclue where Reddit posts/comments fall into the following categories:
is_tech
is_asking_for_help
is_asking_a_question
is_FAANG
Each subsection below provides a glimpse into actual posts/comments that fall in each Regex search pattern.
import sagemakerfrom sagemaker.spark.processing import PySparkProcessorimport time%%timesession = sagemaker.Session()bucket = session.default_bucket()output_prefix_data_submissions =f"project/submissions/yyyy=*"s3_path =f"s3a://{bucket}/{output_prefix_data_submissions}"#print(f"reading submissions from {s3_path}")submissions = spark.read.parquet(s3_path, header=True)#print(f"shape of the submissions dataframe is {submissions.count():,}x{len(submissions.columns)}")%%timeoutput_prefix_data_comments ="project/comments/yyyy=*"s3_path =f"s3a://{bucket}/{output_prefix_data_comments}"#print(f"reading comments from {s3_path}")comments = spark.read.parquet(s3_path, header=True)#print(f"shape of the comments dataframe is {comments.count():,}x{len(comments.columns)}")from pyspark.sql.functions import concat, lit, lower, col, when, array# Getting only the columns we need for cubmissions and commentssubmissions_subset_col = submissions.select("id", "subreddit", "subreddit_id", "title", "selftext", col("created_utc").alias("created_utc_submission"), "num_comments")comments_subset_col = comments.select("link_id", "body", col("created_utc").alias("created_utc_comment"))# Making an "searchable_text" column for taggingsubmissions_subset_col = submissions_subset_col.withColumn("searchable_text", concat(submissions_subset_col["title"], lit(" "), submissions_subset_col["selftext"]))keywords_is_tech = ["tech", "technology", "code", "coding", "computer", "data", "python","java", "javascript", "sql", "database", "statistics", "azure", "cloud computing", "progamming", "leetcode", "saas", "faang"]pattern ="(?i)"+"|(?i)".join(keywords_is_tech)comments_tagged = comments_subset_col .withColumn('is_tech_comments', col('body').rlike(pattern)) .cache()
id
body
TECHNICHAL REDDIT
t3_100a8f0
I got it too. See…
True
t3_100a8f0
I got this too, i…
True
t3_100a8f0
Most leetcode use…
True
Regex Search 2: is_asking_for_help_comments
Keywords: help me, struggle, struggling, anyone, advice, tips, help
Pattern: includes a “?”
Code
import sagemakerfrom sagemaker.spark.processing import PySparkProcessorimport time%%timesession = sagemaker.Session()bucket = session.default_bucket()output_prefix_data_submissions =f"project/submissions/yyyy=*"s3_path =f"s3a://{bucket}/{output_prefix_data_submissions}"#print(f"reading submissions from {s3_path}")submissions = spark.read.parquet(s3_path, header=True)#print(f"shape of the submissions dataframe is {submissions.count():,}x{len(submissions.columns)}")%%timeoutput_prefix_data_comments ="project/comments/yyyy=*"s3_path =f"s3a://{bucket}/{output_prefix_data_comments}"#print(f"reading comments from {s3_path}")comments = spark.read.parquet(s3_path, header=True)#print(f"shape of the comments dataframe is {comments.count():,}x{len(comments.columns)}")from pyspark.sql.functions import concat, lit, lower, col, when, array# Getting only the columns we need for cubmissions and commentssubmissions_subset_col = submissions.select("id", "subreddit", "subreddit_id", "title", "selftext", col("created_utc").alias("created_utc_submission"), "num_comments")comments_subset_col = comments.select("link_id", "body", col("created_utc").alias("created_utc_comment"))# Making an "searchable_text" column for taggingsubmissions_subset_col = submissions_subset_col.withColumn("searchable_text", concat(submissions_subset_col["title"], lit(" "), submissions_subset_col["selftext"]))keywords_help = ["help me", "struggle", "struggling", "anyone", "advice", "tips", "help"]pattern ="(?i)"+"|(?i)".join(keywords_help)comments_tagged = comments_tagged .withColumn('is_asking_for_help_comments', col('body').rlike(pattern)) .cache()
id
body
comment asking for help
t3_100a8f0
I have the 300+…
True
t3_100ebu9
A lot of people j…
True
t3_100ebu9
Solving quest…
True
Regex Search 3: is_asking_a_question_comments
Pattern: includes a “?”
Code
import sagemakerfrom sagemaker.spark.processing import PySparkProcessorimport time%%timesession = sagemaker.Session()bucket = session.default_bucket()output_prefix_data_submissions =f"project/submissions/yyyy=*"s3_path =f"s3a://{bucket}/{output_prefix_data_submissions}"#print(f"reading submissions from {s3_path}")submissions = spark.read.parquet(s3_path, header=True)#print(f"shape of the submissions dataframe is {submissions.count():,}x{len(submissions.columns)}")%%timeoutput_prefix_data_comments ="project/comments/yyyy=*"s3_path =f"s3a://{bucket}/{output_prefix_data_comments}"#print(f"reading comments from {s3_path}")comments = spark.read.parquet(s3_path, header=True)#print(f"shape of the comments dataframe is {comments.count():,}x{len(comments.columns)}")from pyspark.sql.functions import concat, lit, lower, col, when, array# Getting only the columns we need for cubmissions and commentssubmissions_subset_col = submissions.select("id", "subreddit", "subreddit_id", "title", "selftext", col("created_utc").alias("created_utc_submission"), "num_comments")comments_subset_col = comments.select("link_id", "body", col("created_utc").alias("created_utc_comment"))# Making an "searchable_text" column for taggingsubmissions_subset_col = submissions_subset_col.withColumn("searchable_text", concat(submissions_subset_col["title"], lit(" "), submissions_subset_col["selftext"]))comments_tagged = comments_tagged .withColumn('is_asking_a_question_comments', col('body').rlike(r'(?)+')) .cache()
id
body
comment asking a question
t3_1009w0e
I interviewed rec…
True
t3_100a8f0
What do we ch…
True
t3_100a8f0
Heck yeah do …
True
Regex Search 4: is_FAANG_comments
Keywords: facebook, amazon, apple, netflix, google
Pattern: includes a “?”
Code
import sagemakerfrom sagemaker.spark.processing import PySparkProcessorimport time%%timesession = sagemaker.Session()bucket = session.default_bucket()output_prefix_data_submissions =f"project/submissions/yyyy=*"s3_path =f"s3a://{bucket}/{output_prefix_data_submissions}"#print(f"reading submissions from {s3_path}")submissions = spark.read.parquet(s3_path, header=True)#print(f"shape of the submissions dataframe is {submissions.count():,}x{len(submissions.columns)}")%%timeoutput_prefix_data_comments ="project/comments/yyyy=*"s3_path =f"s3a://{bucket}/{output_prefix_data_comments}"#print(f"reading comments from {s3_path}")comments = spark.read.parquet(s3_path, header=True)#print(f"shape of the comments dataframe is {comments.count():,}x{len(comments.columns)}")from pyspark.sql.functions import concat, lit, lower, col, when, array# Getting only the columns we need for cubmissions and commentssubmissions_subset_col = submissions.select("id", "subreddit", "subreddit_id", "title", "selftext", col("created_utc").alias("created_utc_submission"), "num_comments")comments_subset_col = comments.select("link_id", "body", col("created_utc").alias("created_utc_comment"))# Making an "searchable_text" column for taggingsubmissions_subset_col = submissions_subset_col.withColumn("searchable_text", concat(submissions_subset_col["title"], lit(" "), submissions_subset_col["selftext"]))keywords_faang = ["facebook", "amazon", "apple", "netflix", "google"]pattern ="(?i)"+"|(?i)".join(keywords_faang)comments_tagged = comments_tagged .withColumn('is_FAANG_comments', col('body').rlike(pattern)) .cache()
id
body
FAANG comment
t3_1010kbv
When I go for int…
True
t3_1010kbv
I appreciate all …
True
t3_103ppfi
I am interested a…
True
4) Data Additions: Creating New Variables
Five new variables were created using the columsn produced from the regex searches (explained in the previous section). Each of these varibales checks for a mention of one or multiple of the FAANG companies in the comments. The variables (and mentions) that are searched for are Facebook, Amazon, Apple, Netflix, and Google. Additionally, a new ‘multiple’ variable has been created to account for when multiple of these companies have been mentioned in one comment.
At this point in the exploratory data analysis, the data has been cleaned and new variables have been created. This next section aims to perform quality checks on the first draft of a final clean dataset. Performing QC checks and taking the time to actual observe the data is crucial. Simple awareness of a dataset’s attributes such as column names, missing values, df shape, etc., help identify any inconsistencies, errors, or missing information in the dataset that might impact the outcomes of future analysis. Therefore, the following subsections provide a sample of the data for these types of observations.
Checking the Names of the Columns
Code
joined_subset.columns
The code above checks the column names; however, please see the schema in section 7 below for the complete list of columns.
Checking the Number of Rows
Code
joined_subset.count()
114334
Checking for Nulls
Code
joined_subset.select([count(when(col(c).isNull(), c)).alias(c) for c in joined_subset.columns]).show()
There are 8,111 rows with NULL in the comment-related columns. This is to be expected, and indicates that there are 8,111 submissions in the dataset that have no comments, and therefore have missing data in the comment-related fields.
Similarly, there are 934 rows with NULL in the submission-related columns. This indicates that there are 934 comments that respond to submissions outside of the dataset. This is likely due to the connected submission being posted outside the window of time that this dataset tracked. In any case, there is still interest in these comments and will keep them in the dataset.
The distribution of the length of comments seems reasonable. The only result that may raise an eyebrow is the minimum comment length of 1. However, some of the comments are primarily emojis, which contain their own special significance in the world of NLP. For this reason, all of the comments will be kept.
Removing Corrupted Rows
Corrupted rows were filtered out while reading in the data.
6) Data Reformatting
Finally, the data from above needed to be reformatted so that the text is all in the same column and submissions and comments are concatenated rather than joined. The code below shows this logic, and the table shows the top three rows for a selection of the columns.
Code
%%timeimport sagemakersession = sagemaker.Session()output_prefix_data_submissions ="final_tagged_data.parquet/"s3_path =f"s3a://{bucket}/project/{output_prefix_data_submissions}"print(f"reading tagged data from {s3_path}")df = spark.read.parquet(s3_path, header=True)print(f"shape of the submissions dataframe is {df.count():,}x{len(df.columns)}")import pyspark.sql.functions as Fimport pandas as pdimport datetime# Separate into two dataframes (comments and submissions)df_submissions = df.filter(df.created_utc_submission.isNotNull()) .select( F.col('id').alias('link_id'), F.col('created_utc_submission').alias('created_utc'), F.col('searchable_text').alias('body'), F.col('is_tech_submissions').alias('is_tech'), F.col('is_asking_for_help_submissions').alias('is_asking_for_help'), F.col('is_asking_a_question_submissions').alias('is_asking_a_question'), F.col('is_FAANG_submissions').alias('is_FAANG'), F.lit(True).alias('isSubmission') ) .distinct()print("Number of unique submissions:", df_submissions.count())df_comments = df.filter(df.created_utc_comment.isNotNull()) .select('link_id', F.col('created_utc_comment').alias('created_utc'),'body', F.col('is_tech_comments').alias('is_tech'), F.col('is_asking_for_help_comments').alias('is_asking_for_help'), F.col('is_asking_a_question_comments').alias('is_asking_a_question'), F.col('is_FAANG_comments').alias('is_FAANG'), F.lit(False).alias('isSubmission') ) .distinct()print("Number of unique comments:", df_comments.count())# Concatenate comments and submissionsdf_clean = df_submissions.union(df_comments)df_clean.show(10)
Body
Technical Reddit
Asking for help?
Asking a question?
FAANG Reddit
Submission
Amazon Inter…
False
False
True
True
True
Coffee in a…
False
True
True
False
True
Attire for…
False
False
Frue
False
Frue
7) Final Data Set Information
Interesting Columns:
link_id
body
created_utc_comment
subreddit
subreddit_id
title
selftext
num_comments
Number of rows: The shape of the submissions dataframe is 22,122x68 Shape of the comments dataframe is 106,223x21.
This data set was combined by the author of the GitHub repository above from two sources: LEVELS.FYI API and a Kaggle dataset on data science and stem salaries (see README in repository linked above). The original data set contains yearly compensation (total, base salary, bonuses, and stock grants), location, years of experience, and years at the company information for STEM and data science roles within over 1500 companies. This data ranges from 2017 to 2021.
For the project’s purposes, the cleaned data set will average yearly compensation, base salary, bonus, years of experience, and years at company for each company and role type (tech or non-tech). From there, subsets can made for particular companies of interest. Additionally, the ability to focus on tech vs. non-tech roles can be easily achieved through filtering. As seen above, the data has been tagged for containing info on the FAANG companies (Facebook, Amazon, Apple, Netflix, and Google). Plot 5 above was created by merging the main data set with this cleaned external data set to allow for a comparison between the Reddit comment frequency for the FAANG companies with the average yearly compensation and average base salaries at these companies.
Code
# Import librariesimport osimport openpyxlimport pandas as pdimport numpy as np# Read in the datacompany_names = pd.read_csv("../data/external_data/company_name_matching_RAW.csv")salaries = pd.read_excel("../data/external_data/levels_fyi_salary_data_RAW.xlsx", sheet_name ="data")# Subset columnssalaries_subset = salaries[["timestamp", "company", "title", "totalyearlycompensation", "location", "yearsofexperience", "yearsatcompany", "basesalary", "stockgrantvalue", "bonus"]]# Add a year column and drop timestamp columnsalaries_subset["year"] = pd.to_datetime(salaries_subset["timestamp"]).dt.yearsalaries_subset = salaries_subset.drop(["timestamp"], axis =1)# Change data typesdata_types = {"company": str, "title": str, "totalyearlycompensation": float, "location": str, "yearsofexperience": float, "yearsatcompany": float, "basesalary": float, "stockgrantvalue": float, "bonus": float, "year": int}salaries_subset = salaries_subset.astype(data_types)salaries_subset["year"] = pd.to_datetime(salaries_subset["year"], format="%Y")# Create clean company name matchingcompany_mapping =dict(zip(company_names["Variant"].str.strip(), company_names["Clean Company"]))# Make a new column with the clean company namessalaries_subset = salaries_subset.rename(columns = {"company": "old_company"})salaries_subset["company"] = salaries_subset["old_company"].map(company_mapping)salaries_subset = salaries_subset.drop(["old_company"], axis =1)# Categorize available titles as "tech" or "non tech"role_type_dict = {'Product Manager': 'tech', 'Software Engineer': 'tech','Software Engineering Manager': 'tech', 'Data Scientist': 'tech','Solution Architect': 'tech', 'Technical Program Manager': 'tech','Human Resources': 'non tech', 'Product Designer': 'tech', 'Marketing': 'non tech','Business Analyst': 'tech', 'Hardware Engineer': 'tech', 'Sales': 'non tech', 'Recruiter': 'non tech', 'Mechanical Engineer': 'tech', 'Management Consultant': 'non tech'}salaries_subset["role_type"] = salaries_subset["title"].map(role_type_dict)# Rearrange columnssalaries_subset = salaries_subset[["company", "year", "role_type", "title", "totalyearlycompensation", "location", "yearsofexperience","yearsatcompany", "basesalary", "stockgrantvalue", "bonus"]]# Get a summary table of averages by company and role typesummary_df = salaries_subset.groupby(["company", "role_type"]).agg({"totalyearlycompensation": "mean", "yearsofexperience": "mean","yearsatcompany": "mean", "basesalary": "mean","stockgrantvalue": "mean", "bonus": "mean"}).reset_index()summary_df.columns = ["company", "role_type", "average_yearly_compensation", "average_years_experience", "average_years_at_company", "average_base_salary", "average_stock_grant_value", "average_bonus"]# Subset for just FAANG (Facebook, Amazon, Apple, Netflix, Google)faang_df = summary_df[(summary_df["company"] =="Facebook") | (summary_df["company"] =="Amazon") | (summary_df["company"] =="Apple") | (summary_df["company"] =="Netflix") | (summary_df["company"] =="Google")]summary_df.head(20)#faang_df.head(20)
company
role type
average yearly compensation
average years experience
average years at company
average base salary
average stock grant value
average bonus
10x Genomics
Tech
193333.333333
3.166667
0.666667
149666.666667
27666.666667
15166.666667
23andMe
Non Tech
160000.000000
10.000000
4.000000
160000.000000
0.000000
0.000000
23andMe
Tech
152333.333333
2.000000
0.333333
109166.666667
19833.333333
0.000000
Summary Tables
After conducting the necessary quality checks on the dataset, a summary of the information through different perspectives to enhance the team’s overall understanding of the data. This approach allows for a more comprehensive analysis and interpretation of the dataset’s characteristics and trends.
Table 1: Summary Of Regex Searches
The following table shows which regex searches performed. For certian submissions/comments several regex searches can be true at the same time. Only the first 8 rows are printed for demonstration.
The table below provides on overview of the new variables created. It focuses on the mentions of FAANG companies in the comments. Since this website’s focus is on technical interviews, this allows the team to separate ‘the big guns’ on the market from the rest. It is important to note that there are other companies that could be included, but in order the narrow down the search, FAANG alone was chosen.
Since there are significantly more comments than submissions, a summary of the frequency counts for each of the regex searches has been formatted in a table.
In the section below, topics specifically relating to EDA will be explore. The visualizations are broken down into each of the three topics.
TOPIC 1: INTERVIEW POST AND COMMENT FREQUENCY OVER TIME
Goal: Determine the time periods throughout the year with the most submissions (posts) and comments on Reddit regarding technical/coding interviews. Do these windows fall during typical hiring windows? This line of analysis could explain spikes or troughs in job application volume in the big tech industry.
The line graph below illustrates the monthly frequency of submissions and comments over a span of three years (2021, 2022, and 2023) emphasizing user interview engagement trends in Reddit. There is a year-over-year increase, likely influenced by post-COVID interest in technology sectors like NFTs and AI. The peak in 2022 around late summer coincides with common hiring cycles, whereas the consistent 2021 data may reflect the erratic job market during COVID-19. Data up to August 2023 suggests an ongoing rise in engagement, indicative of either growing user participation or platform expansion.
Code
# Plot 1import sagemakersession = sagemaker.Session()bucket = session.default_bucket()output_prefix_data_submissions ="project/submissions/yyyy=*"s3_path =f"s3a://{bucket}/{output_prefix_data_submissions}"#print(f"reading comments from {s3_path}")submissions = spark.read.parquet(s3_path, header=True)#print(f"shape of the comments dataframe is {submissions.count():,}x{len(submissions)from pyspark.sql.functions import year, monthimport matplotlib.pyplot as plt# Extract year and month from the 'created_utc' columnsub_df_with_month = submissions.withColumn("year", year("created_utc")).withColumn("month", month("created_utc"))# Group the data by year and month and count the number of commentssub_counts = sub_df_with_month.groupBy("year", "month").count().orderBy("year", "month").cache()# Convert the result to a Pandas DataFrame for easier plottingsub_counts_pd = sub_counts.toPandas()%%timeimport sagemakersession = sagemaker.Session()bucket = session.default_bucket()output_prefix_data_comments ="project/comments/yyyy=*"s3_path =f"s3a://{bucket}/{output_prefix_data_comments}"#print(f"reading comments from {s3_path}")comments = spark.read.parquet(s3_path, header=True)#print(f"shape of the comments dataframe is {comments.count():,}x{len(comments.columns)}")from pyspark.sql.functions import year, monthimport matplotlib.pyplot as plt# Extract year and month from the 'created_utc' columncomm_df_with_month = comments.withColumn("year", year("created_utc")).withColumn("month", month("created_utc"))# Group the data by year and month and count the number of commentscomment_counts = comm_df_with_month.groupBy("year", "month").count().orderBy("year", "month").cache()# Convert the result to a Pandas DataFrame for easier plottingcomment_counts_pd = comment_counts.toPandas()import pandas as pdcombined_df_pd = pd.merge(sub_counts_pd, comment_counts_pd, on=['year', 'month'], how='outer', suffixes=('_submissions', '_comments'))#combined_df_pd = combined_df_pd.fillna(0)import calendar# Filter the data for each yeardata_2021 = combined_df_pd[combined_df_pd['year'] ==2021]data_2022 = combined_df_pd[combined_df_pd['year'] ==2022]data_2023 = combined_df_pd[combined_df_pd['year'] ==2023]# Convert numeric months to month namesdata_2021['month'] = data_2021['month'].apply(lambda x: calendar.month_name[x])data_2022['month'] = data_2022['month'].apply(lambda x: calendar.month_name[x])data_2023['month'] = data_2023['month'].apply(lambda x: calendar.month_name[x])# Create a line plot with month names on the x-axis and a separate line for each yearplt.figure(figsize=(10, 6))plt.plot(data_2021['month'], data_2021['count_submissions'], marker='o', linestyle='-', label='Submissions 2021', color='#204321')plt.plot(data_2022['month'], data_2022['count_submissions'], marker='o', linestyle='-', label='Submissions 2022', color='#5E9751')plt.plot(data_2023['month'], data_2023['count_submissions'], marker='o', linestyle='-', label='Submissions 2023', color='#82B8B5')plt.plot(data_2021['month'], data_2021['count_comments'], marker='o', linestyle='dotted', label='Comments 2021', color='#163D6B')plt.plot(data_2022['month'], data_2022['count_comments'], marker='o', linestyle='dotted', label='Comments 2022', color='#4A80EB')plt.plot(data_2023['month'], data_2023['count_comments'], marker='o', linestyle='dotted', label='Comments 2023', color='#251279')plt.xlabel('Month')plt.ylabel('Number of Submissions & Comments')plt.title('Submissions & Comments Over Time by Year')plt.xticks(rotation=45) # Rotate x-axis labels for readabilityplt.grid(False)plt.legend()plt.tight_layout()plt.savefig('../data/plots/sub_com_over_time.png', dpi=300) plt.show()
TOPIC 2: POPULAR TECHNICAL INTERVIEW QUESTIONS AND TOPICS
Goal: Determine the most popular interview questions and/or topics to gauge the specific areas of interest regarding technical and coding-related interviews. Questions that are being discussed more frequently can help future applicants streamline how they study for interviews to focus on the topics with the most traction on Reddit. Highlighting content matter that’s seen most frequently can direct students in their studying.
The wordcloud below was created using the body column in the dataset. The body column has all the text from the reddits and subreddits. Since the focus is on both submissions and comments, the two datasets were joined together to make sure all the text to produce an accurate wordcloud were extracted. The text was additionally tokenized to produce a tokens, and all stopwords and special characters have been removed. Finally the vocabulary was flattened and the wordcloud was created from said flattened vocabulary.
Code
# Plot 2# get WordCloud library!pip install matplotlib wordcloud# import librariesfrom pyspark.sql.functions import col, lower, regexp_replace, array_except, array, lit, whenfrom pyspark.ml.feature import Tokenizer, StopWordsRemoverfrom pyspark.sql import functions as Ffrom wordcloud import WordCloudimport matplotlib.pyplot as pltfrom PIL import Imageimport numpy as np# preprocess the text: clean up, tokenize, and remove stop words# make text lowercase, and remove special charactersdf_clean = df.withColumn('body', lower(col('body'))) .withColumn('body', regexp_replace('body', "[^a-zA-Zs]", "")) .withColumn('body', regexp_replace('body', "bw{1,2}b", ""))# tokenize texttokenizer = Tokenizer(inputCol="body", outputCol="words")# transform tokenized textdf_words = tokenizer.transform(df_clean)# remove stopwrodsremover = StopWordsRemover(inputCol="words", outputCol="filtered")df_filtered = remover.transform(df_words)#remove empty stringsempty_string_array = array(lit(''))df_filtered = df_filtered.withColumn("filtered", array_except(col("filtered"), empty_string_array))#flatten the vocabulary listwords_list = df_filtered.select('filtered').rdd.flatMap(lambda x: x).collect()flat_list = [word for sublist in words_list for word in sublist]# join the list to a single string, as wordcloud takes a string as inputword_string =" ".join(flat_list)# adjust figure sizewordcloud = WordCloud(width=1600, height=800, collocations=True, background_color='white').generate(word_string)plt.figure(figsize=(20, 10), dpi=300) plt.imshow(wordcloud, interpolation='bilinear')plt.axis("off")plt.show()
In the word cloud above, the most prominent words are ‘one’, ‘problem’, and ‘interview’; this is absolutely expected based on the fact that the Reddit posts are focused asking questions about technical interviews. The most significant term observed here is ‘LeetCode’ because it indicates a focus on coding or technical interviews, as LeetCode is a platform that provides coding challenges for such purposes. This suggests that the Reddit posts have a strong representation of technical and coding questions, with potential sources or solutions on the LeetCode website. This supports the decision to carry out a regex search for technical Reddit posts.
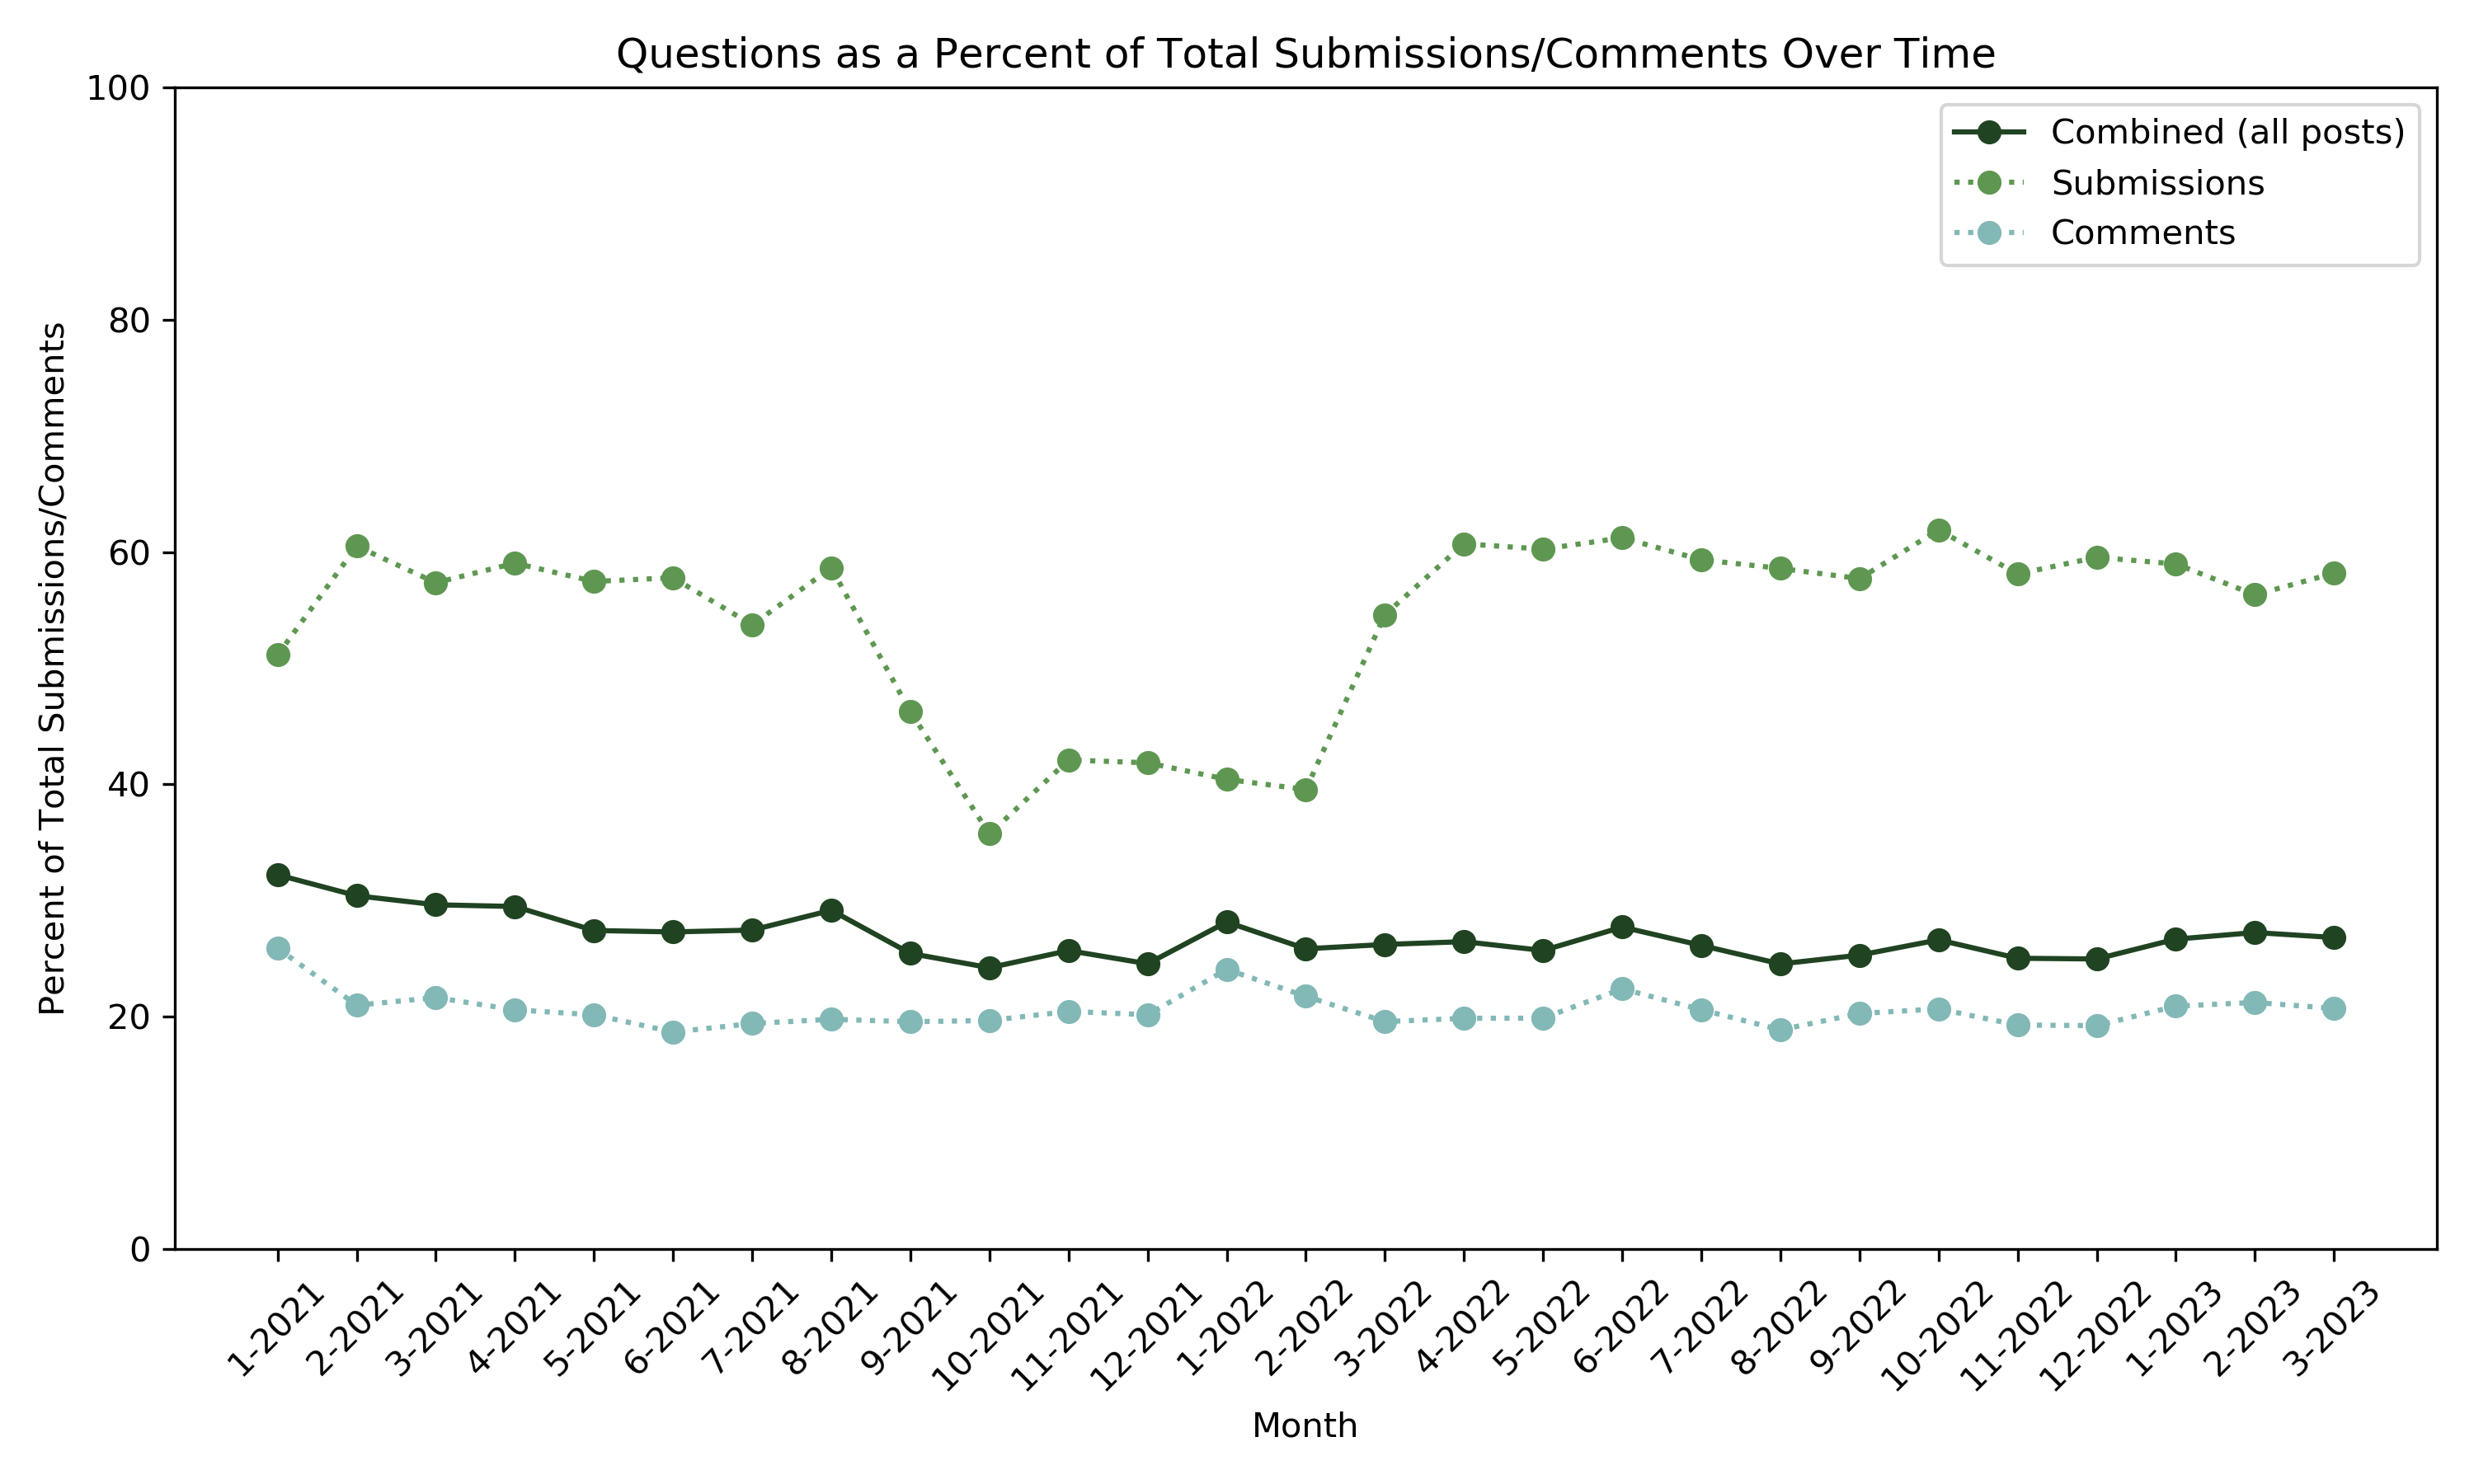
This next plot illustrates the percent of comments and/or submissions in the dataset that pose questions. Submissions and comments were identified as posing a question with a simple regex search that matched a question mark (?) character. In a casual forum like Reddit, it is expected to miss a few questions in which users forget to add a question mark, but the examination of the dataset showed that the accuracy of this regex match was adequately reliable.
Code
# Question countsimport pyspark.sql.functions as Fimport pandas as pdimport datetime# Add date columndf_time = df.withColumn("monthyear", F.concat( F.month("created_utc"), F.lit('-'), F.year("created_utc") ))# Question countsdf_question_counts = df_time.filter('is_asking_a_question').groupBy('monthyear').count()# Submission/comment countsdf_total_counts = df_time.groupBy('monthyear')\ .count()\ .select(F.col('monthyear').alias('monthyear2'), F.col('count').alias('total_count'))# Convert to pandas dataframepd_df1 = df_question_counts.join( df_total_counts, df_question_counts.monthyear == df_total_counts.monthyear2, 'left').select('monthyear', 'count', 'total_count').toPandas()# Reorder pandas dataframepd_df1['month'] = pd_df1['monthyear'].apply(lambda x: int(x.split('-')[0]))pd_df1['year'] = pd_df1['monthyear'].apply(lambda x: int(x.split('-')[1]))pd_df1 = pd_df1.sort_values(['year', 'month']).reset_index(drop=True)# Add ratio of questions to all posts as new columnpd_df1['pct_questions'] = pd_df1['count'] / pd_df1['total_count'] *100pd_df1.head()# Get question counts for submissions# Question countsdf_question_counts_sub = df_time.filter('is_asking_a_question').filter('isSubmission').groupBy('monthyear').count()# Submission/comment countsdf_sub_counts = df_time.filter('isSubmission')\ .groupBy('monthyear')\ .count()\ .select(F.col('monthyear').alias('monthyear2'), F.col('count').alias('total_count'))# Convert to pandas dataframepd_df_sub = df_question_counts_sub.join( df_sub_counts, df_question_counts_sub.monthyear == df_sub_counts.monthyear2, 'left').select('monthyear', 'count', 'total_count').toPandas()# Reorder pandas dataframepd_df_sub['month'] = pd_df_sub['monthyear'].apply(lambda x: int(x.split('-')[0]))pd_df_sub['year'] = pd_df_sub['monthyear'].apply(lambda x: int(x.split('-')[1]))pd_df_sub = pd_df_sub.sort_values(['year', 'month']).reset_index(drop=True)# Add question ratio as new columnpd_df_sub['pct_questions'] = pd_df_sub['count'] / pd_df_sub['total_count'] *100# Get question counts for comments# Question countsdf_question_counts_com = df_time.filter('is_asking_a_question')\ .filter(F.col('isSubmission') ==False)\ .groupBy('monthyear')\ .count()# Submission/comment countsdf_com_counts = df_time.filter(F.col('isSubmission') ==False)\ .groupBy('monthyear')\ .count()\ .select(F.col('monthyear').alias('monthyear2'), F.col('count').alias('total_count'))# Convert to pandas dataframepd_df_com = df_question_counts_com.join( df_com_counts, df_question_counts_com.monthyear == df_com_counts.monthyear2, 'left').select('monthyear', 'count', 'total_count').toPandas()# Reorder pandas dataframepd_df_com['month'] = pd_df_com['monthyear'].apply(lambda x: int(x.split('-')[0]))pd_df_com['year'] = pd_df_com['monthyear'].apply(lambda x: int(x.split('-')[1]))pd_df_com = pd_df_com.sort_values(['year', 'month']).reset_index(drop=True)# Add question ratio as new columnpd_df_com['pct_questions'] = pd_df_com['count'] / pd_df_com['total_count'] *100# Line plotplt.figure(figsize=(10, 6))# Plot aggregated question percentplt.plot( pd_df1['monthyear'], pd_df1['pct_questions'], color='#204321', marker='o', linestyle='-', label="Combined (all posts)")# Plot submission question percentplt.plot( pd_df_sub['monthyear'], pd_df_sub['pct_questions'], color='#5E9751', marker='o', linestyle='dotted', label="Submissions")# Plot comment question percentplt.plot( pd_df_com['monthyear'], pd_df_com['pct_questions'], color='#82B8B5', marker='o', linestyle='dotted', label="Comments")# Annotateplt.xlabel('Month')plt.ylabel('Percent of Total Submissions/Comments')plt.title('Questions as a Percent of Total Submissions/Comments Over Time')plt.xticks(rotation=45) plt.ylim(0, 100)plt.grid(False)plt.legend()plt.tight_layout()plt.savefig('../../website-source/images/question_pcts.png', dpi=300)plt.show()
In the plot above, it’s clear from the solid line that the percent of questions out of all comments and submissions (combined) is roughly constant at about 35% over time. This line suggests that the dataset is primarily comprised of Q&A-type discourse, in which roughly 35% of posts ask questions and the other 65% of posts include (but may not be limited to) direct answers to these questions. This follows the general trend of most Q&A-based Reddit communities, where a user asks a question in the form of a submission, and usually several users respond in the form of comments.
The two dotted lines in the plot seem to confirm this pattern, showing that only about 30% of comments consist of questions (presumably in the form of follow-up questions to the submission) while the remainder of comments likely express statements of fact or opinion that respond to the question posed in the submission. Although the percentage of comments posing questions remains constant over time, the plot shows that the percentage of submissions that pose questions is more volatile. For most of the time, roughly 60% of all submissions in the data pose questions. But from the Fall of 2021 and into the Spring of 2022, the percentage of submissions that pose questions drops to about 40%. Based on the plot in Topic 1, this change in question percentage does not clearly coincide with a change in submission frequency. This suggests that the number of submissions is constant over this time period, but users are posting fewer questions. This sudden drop and rise in questions could be due to a number of possible factors, such as hiring freezes following the COVID-19 hiring surge, changes in subreddit moderator activity, or even random chance associated with smaller sample sizes (there are roughly 500 submissions per month, while comments per month are consistently in the thousands). Regardless of the reason behind this temporary drop in questions, the plot shows that, by and large, the percentage of questions over time is generally constant.
TOPIC 3: FAANG COMPANY BREAKDOWN
Goal: FAANG is an acronym that refers to five of the largest and most influential tech companies in the world: Facebook, Apple, Amazon, Netflix, and Google. Consequently, these companies are often seeking many skilled data scientists and analysts. Observe the data related to the frequency with which these companies are mentioned in posts and comments so individuals can gauge their prevalence in discussions related to job interviews in the tech industry. Use an external dataset containing salary information for each FAANG company to enable insight into how public interest in these companies correlates with compensation.
The bar plot below was created using the new variable, which was created using a regex search - is_FANNG_comments. All comments were searched and times when one of the FAANG companies (Facebook, Amazon, Apple, Netflix, Google) were been mentioned have been idenfitied. For this plot, there was a desire to look at the frequency of comments that include the mentions of FAANG versus the frequency of comments that don’t mention it at all. For that reason a bar plot was chosen to show the team how many comments mention FAANG and how many do not. As expected, there are significantly more comments that do not mention any of the FAANG companies. In fact, the comments that do include FAANG mentions make up only less than 4% of the comments data set.
Code
# Plot 3# make a copy of datadf_faang = df#select columns of interestdf_faang = df_faang.select("link_id", "body", "is_tech_comments", "is_asking_for_help_comments","is_asking_a_question_comments", "is_FAANG_comments")# group by 'is_FAANG_comments' and count each groupfaang_comments_freq = df_faang.groupBy("is_FAANG_comments").count()# collect the data to the driverfaang_comments_data = faang_comments_freq.collect()# prepare the data for plottinglabels = [str(row['is_FAANG_comments']) for row in faang_comments_data] # Convert boolean to string for labelscounts = [row['count'] for row in faang_comments_data]# plot the data using matplotlibfig, ax = plt.subplots(dpi=300)bars = ax.bar(labels, counts, color=['#40B389', '#4A80EB'])# add title and labels to the plotax.set_title('Frequency of FAANG Comments')ax.set_xlabel('Has a Mention of FAANG')ax.set_ylabel('Frequency')# set the x-ticks to correspond to the labelsax.set_xticks([0, 1], labels)# annotate the height of each barfor bar in bars: height = bar.get_height() ax.annotate('{}'.format(height), xy=(bar.get_x() + bar.get_width() /2, height), xytext=(0, 1), # 3 points vertical offset textcoords="offset points", ha='center', va='bottom')# show the plotplt.show()
The following plot is a direct extension of the previous plot. With this plot, the focus is on all the comments that were tagged as true for is_FAANG_comment. Next, the goal was to observe the divide in frequency between the number of times each of the FAANG companies are mentioned. Therefore, 5 bars were created - each for one of the companies (Facebook, Amazon, Apple, Netflix, Google), and additionally also included a bar for muliple compnaies mentions. The multiple variable accounts for all cases where two or more of the FAANG companies were mentioned in one comment. From the visual, Google has been mentioned significantly more than the other companies. On the other hand, Netflix was hardly ever mentioned. The hypothesis is that it because Netflix as a streming platform requires very specific typle of skills, while for the other companies the skills are more general.
Code
# Plot 4#get only rows where is_FAANG_comments == Truedf_FAANG_True = df_faang.filter(df_faang.is_FAANG_comments ==True)#select columns of interestdf_FAANG_True = df_FAANG_True.select("link_id","body","is_FAANG_comments")#make all text lowercasedf_FAANG_True= df_FAANG_True.withColumn("body", lower(col("body")))#add new columns based on companydf_new_faang = df_FAANG_True.withColumn("Facebook", when(col("body").like("%facebook%"), True).otherwise(False)) .withColumn("Amazon", when(col("body").like("%amazon%"), True).otherwise(False)) .withColumn("Apple", when(col("body").like("%apple%"), True).otherwise(False)) .withColumn("Netflix", when(col("body").like("%netflix%"), True).otherwise(False)) .withColumn("Google", when(col("body").like("%google%"), True).otherwise(False)) .withColumn("Multiple", when((col("body").like("%facebook%") & col("body").like("%amazon%")) | (col("body").like("%facebook%") & col("body").like("%apple%")) | (col("body").like("%facebook%") & col("body").like("%netflix%")) | (col("body").like("%facebook%") & col("body").like("%google%")) | (col("body").like("%amazon%") & col("body").like("%apple%")) | (col("body").like("%amazon%") & col("body").like("%netflix%")) | (col("body").like("%amazon%") & col("body").like("%google%")) | (col("body").like("%apple%") & col("body").like("%netflix%")) | (col("body").like("%apple%") & col("body").like("%google%")) | (col("body").like("%netflix%") & col("body").like("%google%")),True).otherwise(False))faang_sums = df_new_faang.select( [F.sum(F.col(c).cast("int")).alias(c) for c in ['Facebook', 'Amazon', 'Apple', 'Netflix', 'Google', 'Multiple']]).collect()[0].asDict()#define a list of colors for the barscolors = ['#5E9751', '#40B389', '#251279', '#6CACED', '#82B8B5', '#4A80EB']#make sure we have as many colors as we have companiesassertlen(colors) ==len(faang_sums.keys()), "Number of colors must match the number of companies"#create a bar plot with the specified colorsplt.figure(dpi=300 )plt.bar(faang_sums.keys(), faang_sums.values(), color=colors)#add titles and labelsplt.title('Frequency of FAANG Mentions')plt.xlabel('Company')plt.ylabel('Frequency')plt.xticks(rotation=45)#add value labels on top of each barfor i, (key, value) inenumerate(faang_sums.items()): plt.text(i, value, str(value), ha='center', va='bottom', color='black')#show the plotplt.tight_layout()plt.show()
The plot below was created using the frequency of FAANG mentions in the Reddit post comments broken down by each company within “FAANG.” Comments that included multiple FAANG companies were excluded from this visualization. The external data set (described in more detail at the end of this page) provided the average yearly compensation and base salary information for each of the 5 companies once it was filtered and cleaned. For more information on the cleaning process of the external data set, please see the last section on this page.
There are many interesting takeaways from the plot. First, it is clear that there is not a direct association between the frequency that a company is mentioned in the selection of Reddit comments and the average compensation and average base salary at that company. Netflix is hardly mentioned; Netflix’s average yearly compensation and average base salary is higher than the rest of the FAANG companies according to the additional data set. Interestingly, the two companies mentioned the most in the Reddit comments (Google and Amazon) do not have the highest compensation metrics. Of course, this is only a subset of Reddit comments and the compensation metrics are based off an external data set, so these takeaways should be used with caution.
NOTE: The compensation and base salary averages were calculated using data from 2017 to 2021 for each of these companies.
Code
# Plot 5# Filter out comments with multiple FAANG mentions - just get the ones that specifically mention 1 FAANGfrom pyspark.sql.functions import col, when, litdf_one_faang = df.filter(col("Multiple") ==False)# Check new row countdf_one_faang.count()# Prep for merge with external by making a company columndf_one_faang = df_one_faang.withColumn("company", when(col("Facebook") ==True, lit("Facebook")) .when(col("Apple") ==True, lit("Apple")) .when(col("Amazon") ==True, lit("Amazon")) .when(col("Google") ==True, lit("Google")) .when(col("Netflix") ==True, lit("Netflix")) .otherwise(lit("Other")))# Convert to pandas since small, dont need sparkjosh_df_pandas = df_one_faang.select("link_id", "body", "company").toPandas()# Read in the external data setall_salary_info = pd.read_csv("../data/external_data/all_company_salary_info_CLEAN.csv")faang_salary_info = pd.read_csv("../data/external_data/faang_salary_info_CLEAN.csv")# Drop index columnfaang_salary_info = faang_salary_info.drop(["Unnamed: 0"], axis =1)# Round float valuesfaang_salary_info = faang_salary_info.apply(lambda x: round(x, 2) if x.dtype =='float64'else x)# Average tech and non-tech datafaang_df = faang_salary_info.groupby(["company"]).agg({"average_yearly_compensation": "mean", "average_years_experience": "mean","average_years_at_company": "mean", "average_base_salary": "mean","average_stock_grant_value": "mean", "average_bonus": "mean"}).reset_index()merged_df = josh_df_pandas.merge(faang_df, on ="company", how ="left")company_counts = merged_df["company"].value_counts()average_compensation = merged_df.groupby("company")["average_yearly_compensation"].mean()average_base = merged_df.groupby("company")["average_base_salary"].mean()average_experience = merged_df.groupby("company")["average_years_experience"].mean()average_stock_grant = merged_df.groupby("company")["average_stock_grant_value"].mean()fig, ax1 = plt.subplots(figsize = (10, 6))ax2 = ax1.twinx()# Set the bar width and positionsbar_width =0.2x = np.arange(len(company_counts.index))ax1.bar(x - bar_width/3*2, company_counts, bar_width, label='Mention Frequency', alpha=1, color='#5164A1')ax2.bar(x + bar_width/3, average_compensation, bar_width, label='Average Yearly Compensation', alpha=1, color='#82B8B5')ax2.bar(x + bar_width/3*4, average_base, bar_width, label='Average Base Salary', alpha=1, color='#5E9751')# Set labelsax1.set_xticks(x)ax1.set_xticklabels(company_counts.index, rotation=0)ax1.set_ylabel('Mention Frequency', color='black')ax2.set_ylabel('Average Yearly Compensation/Average Base Salary', color='black')# Combine legend and put outside of plotlines, labels = ax1.get_legend_handles_labels()lines2, labels2 = ax2.get_legend_handles_labels()ax1.legend(lines + lines2, labels + labels2, loc='upper left', bbox_to_anchor=(0.27, 1))# Set title and footerplt.title('Mention Frequency vs. Average Yearly Compensation and Base Salary by FAANG Company')plt.figtext(0.1, 0.01, 'Note: Comments and submissions mentioning multiple FAANG companies were not included.', fontsize=10, color='black')# Save figureplt.savefig('../data/imgs/faang_salary_breakdown.png', dpi =300)plt.show()
Source Code
## Exploratory Data AnalysisThe following page is dedicated solely to the different exploratory data analytics methods performed to gain further insight into the Reddit data, specifically the Reddits relating to interviews and technical discussions around job applications and technical career preparation. The page is broken down into the following sections: 1) Data Preparation (broken into eight different sub-sections)2) Summary Tables3) Visualizations (broken down by three EDA topics)4) Additional Data Set### Data Preparation#### 1) Data FilteringBefore exploring the topics above, the data needs to be filtered for the subreddit topics of interest and cleaned appropriately. This section describes and shows how the data was cleaned and prepared. The following plot illustrates the distribution of submissions and comments across the different subreddits that data was pulled from. These included:1. `leetcode`2. `interviewpreparations`3. `codinginterview`4. `InterviewTips`5. `csinterviewproblems`6. `interviews`7. `big_tech_interviews`The most prominent subreddit is clearly `leetcode`, which shows that the dataset is largely concerned with technical/coding interview experiences. However, the second-most prominent subreddit is `interviews`, which introduces some necessary discussion of behavioral/professional interview experiences into the dataset.```{python}#| eval: False# Subreddit breakdownimport pyspark.sql.functions as Fimport pandas as pdimport datetime# Combine submissions and commentssubmissions_subreddits = submissions.select('subreddit')comments_subreddits = comments.select('subreddit')subreddits = submissions_subreddits.union(comments_subreddits).cache()# Count total submissions and comments by subredditsubreddit_counts = subreddits.groupBy('subreddit').count().cache()# Convert to pandas dataframeimport pandas as pdsubreddit_counts_pd = subreddit_counts.toPandas()# subreddit_counts.count()import matplotlib.pyplot as pltplt.figure(figsize=(10, 6))# Plot the data using matplotlibfig, ax = plt.subplots(dpi=300)bars = ax.bar( subreddit_counts_pd['subreddit'], subreddit_counts_pd['count'], color=['#40B389', '#4A80EB', '#5E9751', '#163D6B'])# Add title and labels to the plotax.set_title('Breakdown of Comment and Submission Counts by Subreddit')ax.set_xlabel('Subreddit')ax.set_ylabel('Comment and Submission Count')ax.xaxis.set_tick_params(rotation=45)# Annotate the height of each barfor bar in bars: height = bar.get_height() ax.annotate('{}'.format(height), xy=(bar.get_x() + bar.get_width() /2, height), xytext=(0, 1), # 3 points vertical offset textcoords="offset points", ha='center', va='bottom')plt.savefig('../data/plots/subreddit_breakdown.png', dpi=300)# Show the plotplt.show()```<!-- 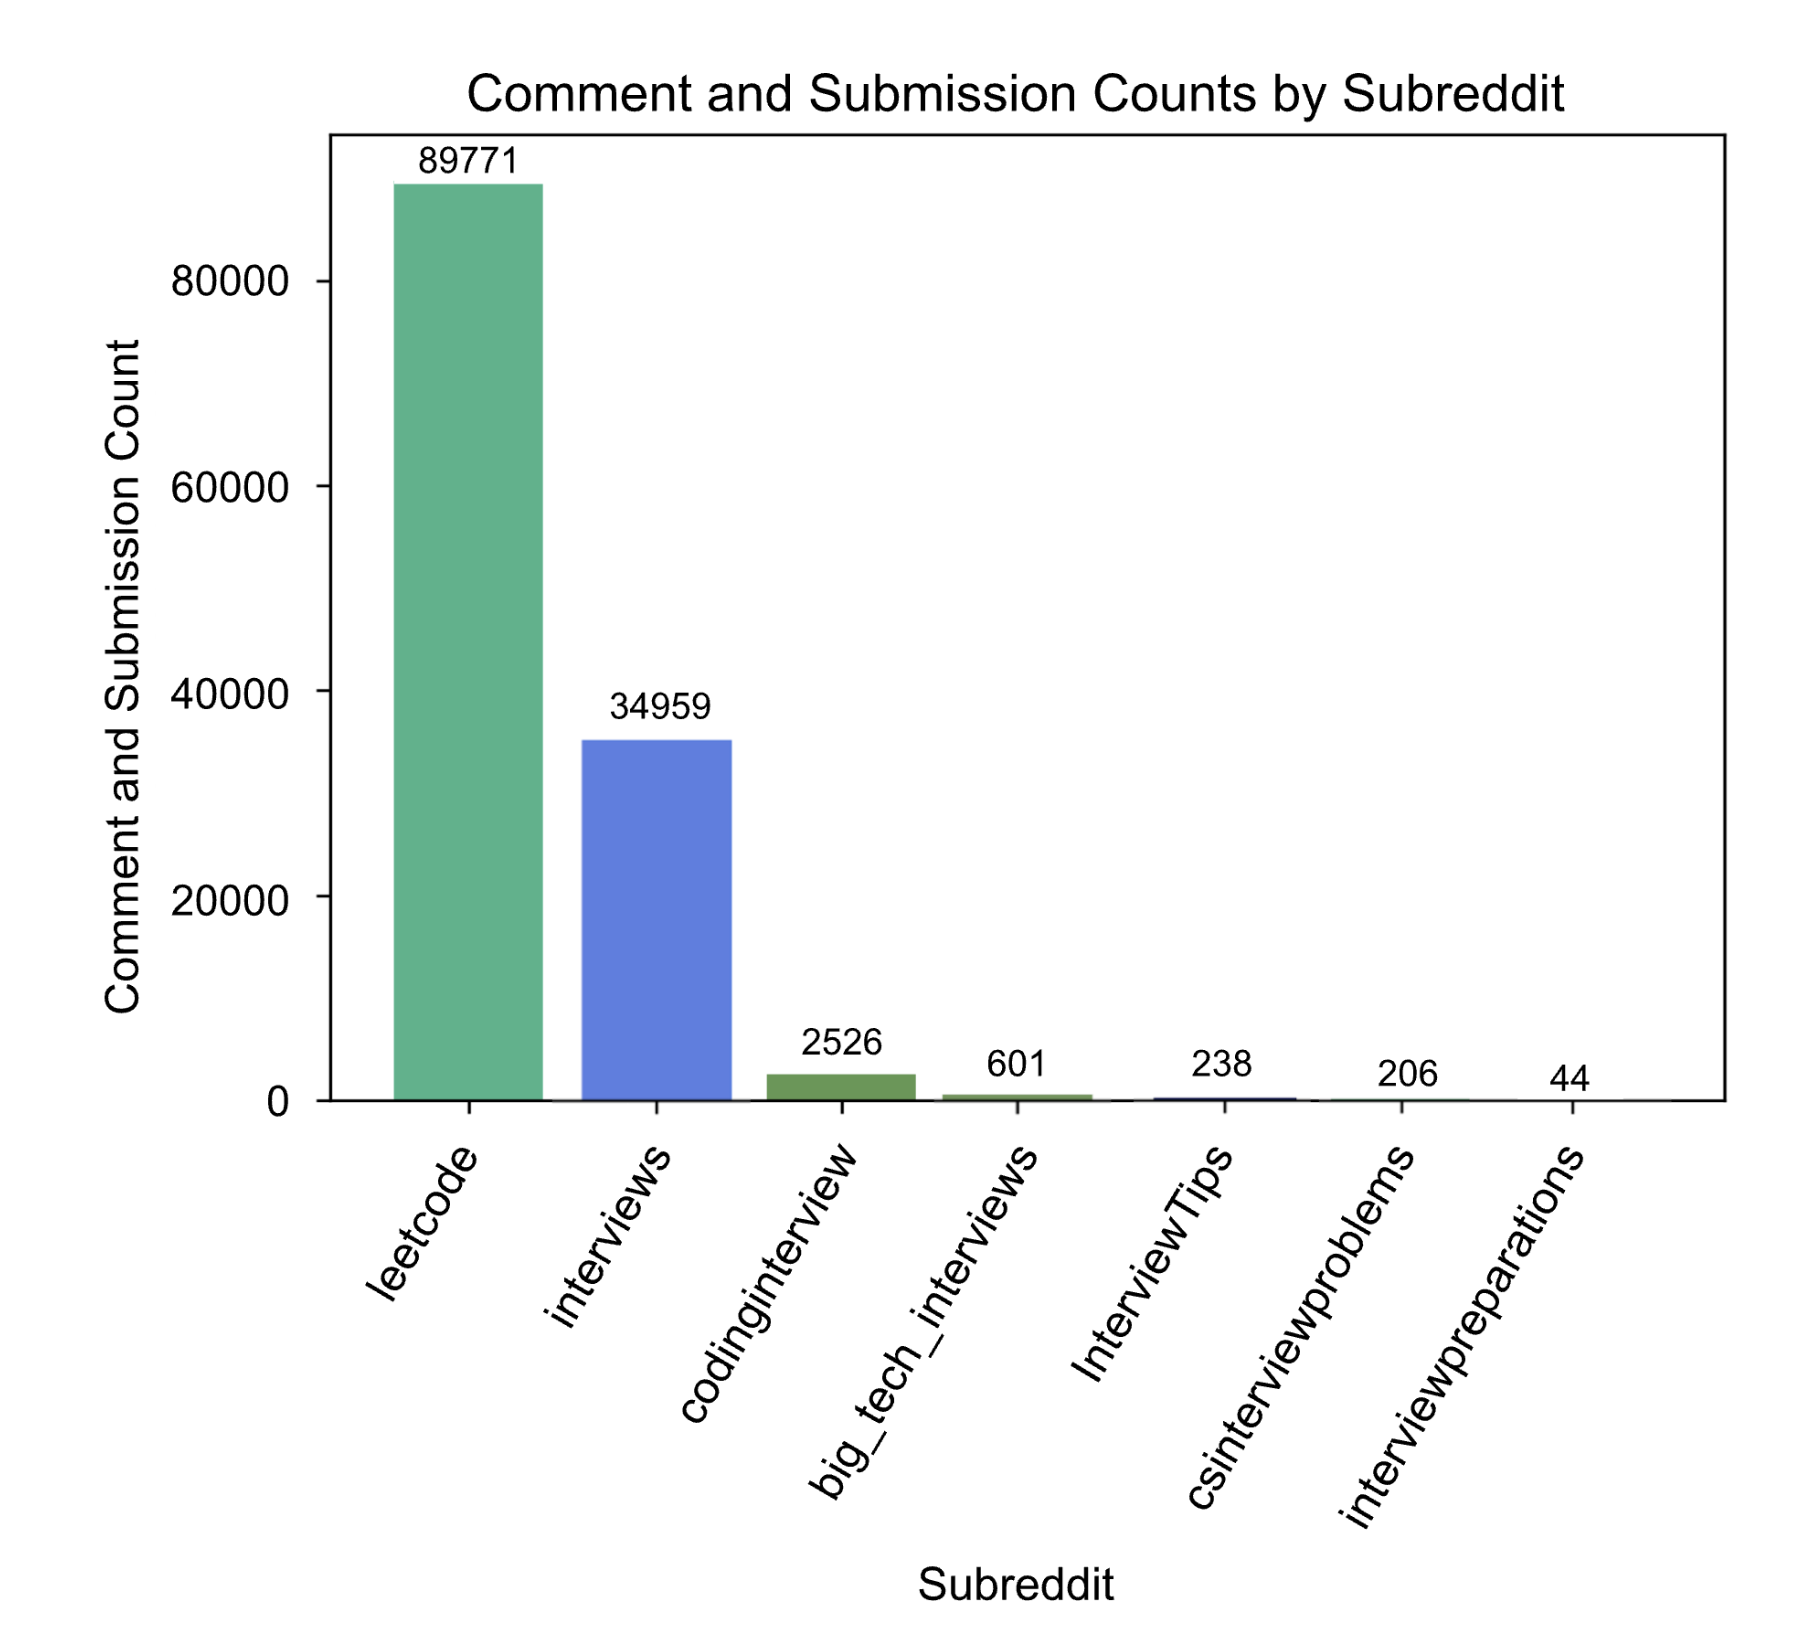 --><imgsrc="images/subreddit_breakdown.png"alt="Subreddit Breakdown"style="width: 70%; height: auto;"/>#### 2) Data CleaningThis section covers code used to clean and organize the Reddit posts and comments for further analysis. The data is then broken out into tables, highlighting key columns such as IDs, subreddit information, and textual content. This process of cleaning involves preparing the data in a way that makes it more accessible and suitable for future in-depth analysis with regards to online social commentary on technical interviews.```{python}#| eval: False# DATA CLEANINGimport sagemakerfrom sagemaker.spark.processing import PySparkProcessorimport time%%timesession = sagemaker.Session()bucket = session.default_bucket()output_prefix_data_submissions =f"project/submissions/yyyy=*"s3_path =f"s3a://{bucket}/{output_prefix_data_submissions}"#print(f"reading submissions from {s3_path}")submissions = spark.read.parquet(s3_path, header=True)print(f"Shape of the submissions dataframe is {submissions.count():,}x{len(submissions.columns)}")%%timeoutput_prefix_data_comments ="project/comments/yyyy=*"s3_path =f"s3a://{bucket}/{output_prefix_data_comments}"#print(f"reading comments from {s3_path}")comments = spark.read.parquet(s3_path, header=True)print(f"Shape of the comments dataframe is {comments.count():,}x{len(comments.columns)}")from pyspark.sql.functions import concat, lit, lower, col, when, array# Getting only the columns we need for cubmissions and commentssubmissions_subset_col = submissions.select("id", "subreddit", "subreddit_id", "title", "selftext", col("created_utc").alias("created_utc_submission"), "num_comments")comments_subset_col = comments.select("link_id", "body", col("created_utc").alias("created_utc_comment"))# Making an "searchable_text" column for taggingsubmissions_subset_col = submissions_subset_col.withColumn("searchable_text", concat(submissions_subset_col["title"], lit(" "), submissions_subset_col["selftext"]))# Regex 1keywords_is_tech = ["tech", "technology", "code", "coding", "computer", "data", "python","java", "javascript", "sql", "database", "statistics", "azure", "cloud computing", "progamming", "leetcode", "saas", "faang"]pattern ="(?i)"+"|(?i)".join(keywords_is_tech)comments_tagged = comments_subset_col .withColumn('is_tech_comments', col('body').rlike(pattern)) .cache()submissions_tagged = submissions_subset_col .withColumn('is_tech_submissions', col('searchable_text').rlike(pattern))# Regex 2keywords_help = ["help me", "struggle", "struggling", "anyone", "advice", "tips", "help"]pattern ="(?i)"+"|(?i)".join(keywords_help)submissions_tagged = submissions_tagged .withColumn('is_asking_for_help_submissions', col('searchable_text').rlike(pattern))comments_tagged = comments_tagged .withColumn('is_asking_for_help_comments', col('body').rlike(pattern)) .cache()# Regex 3submissions_tagged = submissions_tagged .withColumn('is_asking_a_question_submissions', col('searchable_text').rlike(r'(?)+'))comments_tagged = comments_tagged .withColumn('is_asking_a_question_comments', col('body').rlike(r'(?)+')) .cache()# Regex 4keywords_faang = ["facebook", "amazon", "apple", "netflix", "google"]pattern ="(?i)"+"|(?i)".join(keywords_faang)submissions_tagged = submissions_tagged .withColumn('is_FAANG_submissions', col('searchable_text').rlike(pattern)) .cache()comments_tagged = comments_tagged .withColumn('is_FAANG_comments', col('body').rlike(pattern)) .cache()# Join comments and submissionsjoined_subset = comments_new_id.join(submissions_tagged, comments_new_id['link_id'] == submissions_tagged['id'], 'outer')```#### 3) Data Tagging: Regex SearchesThe following section incorporates Regex searches to create new information in the data - particulary attributes the inclue where Reddit posts/comments fall into the following categories:- is_tech- is_asking_for_help- is_asking_a\_question- is_FAANGEach subsection below provides a glimpse into actual posts/comments that fall in each Regex search pattern.##### Regex Search 1: is_tech_comments**Keywords:** tech, technology, code, coding, computer, data, python, java, javascript, sql, database, statistics, azure, cloud computing, progamming, leetcode, saas, faang```{python}#| eval: Falseimport sagemakerfrom sagemaker.spark.processing import PySparkProcessorimport time%%timesession = sagemaker.Session()bucket = session.default_bucket()output_prefix_data_submissions =f"project/submissions/yyyy=*"s3_path =f"s3a://{bucket}/{output_prefix_data_submissions}"#print(f"reading submissions from {s3_path}")submissions = spark.read.parquet(s3_path, header=True)#print(f"shape of the submissions dataframe is {submissions.count():,}x{len(submissions.columns)}")%%timeoutput_prefix_data_comments ="project/comments/yyyy=*"s3_path =f"s3a://{bucket}/{output_prefix_data_comments}"#print(f"reading comments from {s3_path}")comments = spark.read.parquet(s3_path, header=True)#print(f"shape of the comments dataframe is {comments.count():,}x{len(comments.columns)}")from pyspark.sql.functions import concat, lit, lower, col, when, array# Getting only the columns we need for cubmissions and commentssubmissions_subset_col = submissions.select("id", "subreddit", "subreddit_id", "title", "selftext", col("created_utc").alias("created_utc_submission"), "num_comments")comments_subset_col = comments.select("link_id", "body", col("created_utc").alias("created_utc_comment"))# Making an "searchable_text" column for taggingsubmissions_subset_col = submissions_subset_col.withColumn("searchable_text", concat(submissions_subset_col["title"], lit(" "), submissions_subset_col["selftext"]))keywords_is_tech = ["tech", "technology", "code", "coding", "computer", "data", "python","java", "javascript", "sql", "database", "statistics", "azure", "cloud computing", "progamming", "leetcode", "saas", "faang"]pattern ="(?i)"+"|(?i)".join(keywords_is_tech)comments_tagged = comments_subset_col .withColumn('is_tech_comments', col('body').rlike(pattern)) .cache()```| link_id | body | is_tech_comments ||------------|----------------------|------------------|| t3_100a8f0 | I got it too. See... | true || t3_100a8f0 | I got this too, i... | true || t3_100a8f0 | Most leetcode use... | true || t3_100dubf | Only .2% of leetc... | true || t3_100ebu9 | Competitive codin... | true |##### Regex Search 2: is_asking_for_help_comments**Keywords:** help me, struggle, struggling, anyone, advice, tips, help**Pattern:** includes a "?"```{python}#| eval: Falseimport sagemakerfrom sagemaker.spark.processing import PySparkProcessorimport time%%timesession = sagemaker.Session()bucket = session.default_bucket()output_prefix_data_submissions =f"project/submissions/yyyy=*"s3_path =f"s3a://{bucket}/{output_prefix_data_submissions}"#print(f"reading submissions from {s3_path}")submissions = spark.read.parquet(s3_path, header=True)#print(f"shape of the submissions dataframe is {submissions.count():,}x{len(submissions.columns)}")%%timeoutput_prefix_data_comments ="project/comments/yyyy=*"s3_path =f"s3a://{bucket}/{output_prefix_data_comments}"#print(f"reading comments from {s3_path}")comments = spark.read.parquet(s3_path, header=True)#print(f"shape of the comments dataframe is {comments.count():,}x{len(comments.columns)}")from pyspark.sql.functions import concat, lit, lower, col, when, array# Getting only the columns we need for cubmissions and commentssubmissions_subset_col = submissions.select("id", "subreddit", "subreddit_id", "title", "selftext", col("created_utc").alias("created_utc_submission"), "num_comments")comments_subset_col = comments.select("link_id", "body", col("created_utc").alias("created_utc_comment"))# Making an "searchable_text" column for taggingsubmissions_subset_col = submissions_subset_col.withColumn("searchable_text", concat(submissions_subset_col["title"], lit(" "), submissions_subset_col["selftext"]))keywords_help = ["help me", "struggle", "struggling", "anyone", "advice", "tips", "help"]pattern ="(?i)"+"|(?i)".join(keywords_help)comments_tagged = comments_tagged .withColumn('is_asking_for_help_comments', col('body').rlike(pattern)) .cache()```| link_id | body | is_asking_for_help_comments ||------------|--------------------|-----------------------------|| t3_100a8f0 | I have the 300+… | true || t3_100ebu9 | A lot of people j… | true || t3_100ebu9 | Solving quest… | true || t3_100ebu9 | I have 300 lc pro… | true || t3_100onp5 | Dynamic Progra… | true |##### Regex Search 3: is_asking_a\_question_comments**Pattern:** includes a "?"```{python}#| eval: Falseimport sagemakerfrom sagemaker.spark.processing import PySparkProcessorimport time%%timesession = sagemaker.Session()bucket = session.default_bucket()output_prefix_data_submissions =f"project/submissions/yyyy=*"s3_path =f"s3a://{bucket}/{output_prefix_data_submissions}"#print(f"reading submissions from {s3_path}")submissions = spark.read.parquet(s3_path, header=True)#print(f"shape of the submissions dataframe is {submissions.count():,}x{len(submissions.columns)}")%%timeoutput_prefix_data_comments ="project/comments/yyyy=*"s3_path =f"s3a://{bucket}/{output_prefix_data_comments}"#print(f"reading comments from {s3_path}")comments = spark.read.parquet(s3_path, header=True)#print(f"shape of the comments dataframe is {comments.count():,}x{len(comments.columns)}")from pyspark.sql.functions import concat, lit, lower, col, when, array# Getting only the columns we need for cubmissions and commentssubmissions_subset_col = submissions.select("id", "subreddit", "subreddit_id", "title", "selftext", col("created_utc").alias("created_utc_submission"), "num_comments")comments_subset_col = comments.select("link_id", "body", col("created_utc").alias("created_utc_comment"))# Making an "searchable_text" column for taggingsubmissions_subset_col = submissions_subset_col.withColumn("searchable_text", concat(submissions_subset_col["title"], lit(" "), submissions_subset_col["selftext"]))comments_tagged = comments_tagged .withColumn('is_asking_a_question_comments', col('body').rlike(r'(?)+')) .cache()```| link_id | body | is_asking_a\_question_comments ||------------|--------------------|--------------------------------|| t3_1009w0e | I interviewed rec… | true || t3_100a8f0 | What do we ch… | true || t3_100a8f0 | Heck yeah do … | true || t3_100a8f0 | Just curious, wil… | true || t3_100a8f0 | I got this too, i… | true |##### Regex Search 4: is_FAANG_comments**Keywords:** facebook, amazon, apple, netflix, google**Pattern:** includes a "?"```{python}#| eval: Falseimport sagemakerfrom sagemaker.spark.processing import PySparkProcessorimport time%%timesession = sagemaker.Session()bucket = session.default_bucket()output_prefix_data_submissions =f"project/submissions/yyyy=*"s3_path =f"s3a://{bucket}/{output_prefix_data_submissions}"#print(f"reading submissions from {s3_path}")submissions = spark.read.parquet(s3_path, header=True)#print(f"shape of the submissions dataframe is {submissions.count():,}x{len(submissions.columns)}")%%timeoutput_prefix_data_comments ="project/comments/yyyy=*"s3_path =f"s3a://{bucket}/{output_prefix_data_comments}"#print(f"reading comments from {s3_path}")comments = spark.read.parquet(s3_path, header=True)#print(f"shape of the comments dataframe is {comments.count():,}x{len(comments.columns)}")from pyspark.sql.functions import concat, lit, lower, col, when, array# Getting only the columns we need for cubmissions and commentssubmissions_subset_col = submissions.select("id", "subreddit", "subreddit_id", "title", "selftext", col("created_utc").alias("created_utc_submission"), "num_comments")comments_subset_col = comments.select("link_id", "body", col("created_utc").alias("created_utc_comment"))# Making an "searchable_text" column for taggingsubmissions_subset_col = submissions_subset_col.withColumn("searchable_text", concat(submissions_subset_col["title"], lit(" "), submissions_subset_col["selftext"]))keywords_faang = ["facebook", "amazon", "apple", "netflix", "google"]pattern ="(?i)"+"|(?i)".join(keywords_faang)comments_tagged = comments_tagged .withColumn('is_FAANG_comments', col('body').rlike(pattern)) .cache()```| link_id | body | is_FAANG_comments ||------------|----------------------|-------------------|| t3_1010kbv | When I go for int... | true || t3_1010kbv | I appreciate all ... | true || t3_103ppfi | I am interested a... | true || t3_104wf74 | SOURCE: https://s... | true || t3_105fbkg | I think this is a... | true |#### 4) Data Additions: Creating New VariablesFive new variables were created using the columsn produced from the regex searches (explained in the previous section). Each of these varibales checks for a mention of one or multiple of the FAANG companies in the comments. The variables (and mentions) that are searched for are Facebook, Amazon, Apple, Netflix, and Google. Additionally, a new 'multiple' variable has been created to account for when multiple of these companies have been mentioned in one comment.```{python}#| eval: False%%timesession = sagemaker.Session()bucket ='tm1450-project'#output_prefix_data_submissions = f"project/submissions/yyyy=*"output_prefix_data_submissions =f"final_tagged_data.parquet/"s3_path =f"s3a://{bucket}/{output_prefix_data_submissions}"df = spark.read.parquet(s3_path, header=True)```##### New Variable 1: Facebook MentionsThe following provides a glimpse of the data when Facebook is mentioned. If so, the new variable will be true, otherwise it's false.```{python}#| eval: Falsedf_FAANG_True= df_FAANG_True.withColumn("body", lower(col("body")))df_new_faang = df_FAANG_True.withColumn("Facebook", when(col("body").like("%facebook%"), True).otherwise(False))df_new_faang=df_new_faang.select("link_id", "body","is_FAANG_comments", "Facebook")df_new_faang.where(col("Facebook") ==True).show(20, truncate=True)```| link_id | body | is_FAANG_comments | Facebook ||------------|---------------------|-------------------|----------|| t3_117gmt1 | \[https://leetcode… | true | true || t3_11afkew | hey, went through… | true | true || t3_jck8os | Omg, stop saying … | true | true || t3_jck8os | \[facebookrecruiti… | true | true || t3_jck8os | You’ll notice \[fa… | true | true |##### New Variable 2: Amazon MentionsIf Amazon is mentioned, this variable will be true, otherwise it's false.```{python}#| eval: Falsedf_new_faang = df_FAANG_True.withColumn("Amazon", when(col("body").like("%amazon%"), True).otherwise(False))df_new_faang=df_new_faang.select("link_id", "body","is_FAANG_comments", "Amazon")df_new_faang.where(col("Amazon") ==True).show(20, truncate=True)```| link_id | body | is_FAANG_comments | Amazon ||------------|----------------------|-------------------|--------|| t3_10cccra | Here is what I wo… | true | true || t3_10cccra | I think the real … | true | true || t3_10h69zq | Here are some lin… | true | true || t3_111t0kf | Just saw \[this\](h… | true | true || t3_112xb4g | Daily challenge +… | true | true |##### New Variable 3: Apple MentionsIf Apple is mentioned, this variable will be true, otherwise it's false.```{python}#| eval: Falsedf_new_faang = df_FAANG_True.withColumn("Apple", when(col("body").like("%apple%"), True).otherwise(False))df_new_faang=df_new_faang.select("link_id", "body","is_FAANG_comments", "Apple")df_new_faang.where(col("Apple") ==True).show(20, truncate=True)```| link_id | body | is_FAANG_comments | Apple ||------------|-------------------|-------------------|-------|| t3_109g5hw | just use some… | true | true || t3_11ohugl | It was personal… | true | true || t3_120284u | I have heard it… | true | true || t3_120284u | An apple recruit… | true | true || t3_120284u | Hey, really curi… | true | true |##### New Variable 4: Netflix MentionsIf Netflix is mentioned, this variable will be true, otherwise it's false.```{python}#| eval: Falsedf_new_faang = df_FAANG_True.withColumn("Netflix", when(col("body").like("%netflix%"), True).otherwise(False))df_new_faang=df_new_faang.select("link_id", "body","is_FAANG_comments", "Netflix")df_new_faang.where(col("Netflix") ==True).show(20, truncate=True)```| link_id | body | is_FAANG_comments | Netflix ||-----------|---------------------|-------------------|---------|| t3_n09dlg | without netflix i… | true | true || t3_pa6044 | If you want a tim… | true | true || t3_u74ujy | \[https://imgur.co… | true | true || t3_uksgf5 | go and watch ne… | true | true || t3_vrjr16 | to also add to th… | true | true |##### New Variable 5: Google MentionsIf Google is mentioned, this variable will be true, otherwise it's false.```{python}#| eval: Falsedf_new_faang = df_FAANG_True.withColumn("Google", when(col("body").like("%google%"), True).otherwise(False))df_new_faang=df_new_faang.select("link_id", "body","is_FAANG_comments", "Google")df_new_faang.where(col("Google") ==True).show(20, truncate=True)```| link_id | body | is_FAANG_comments | Google ||------------|--------------------|-------------------|--------|| t3_1010kbv | When I go for int… | true | true || t3_1010kbv | I appreciate all … | true | true || t3_105fbkg | I think this is a… | true | true || t3_107056x | I am 16, however … | true | true || t3_10775b6 | Bro is an ex-go… | true | true |##### New Variable 5: Multiple FAANG Companies MentionsIf more than one FAANG company is mentioned, this variable will be true. If one or none FAANG comapny is mentioned, this variable is false.```{python}#| eval: Falsedf_faang_Apple = df_FAANG_True.withColumn("Multiple", when((col("body").like("%facebook%") & col("body").like("%amazon%")) | (col("body").like("%facebook%") & col("body").like("%apple%")) | (col("body").like("%facebook%") & col("body").like("%netflix%")) | (col("body").like("%facebook%") & col("body").like("%google%")) | (col("body").like("%amazon%") & col("body").like("%apple%")) | (col("body").like("%amazon%") & col("body").like("%netflix%")) | (col("body").like("%amazon%") & col("body").like("%google%")) | (col("body").like("%apple%") & col("body").like("%netflix%")) | (col("body").like("%apple%") & col("body").like("%google%")) | (col("body").like("%netflix%") & col("body").like("%google%")),True).otherwise(False))df_faang_Apple.where(col("Multiple") ==True).show(20, truncate=True)```| link_id | body | is_FAANG_comments | Multiple ||------------|--------------------|-------------------|----------|| t3_108dzhl | yea, i agree with… | true | true || t3_10k842y | yes i agree, only… | true | true || t3_113wq8t | you can take a… | true | true || t3_11afkew | hey, went thro… | true | true || t3_11bl3rd | because it se … | true | true |#### 5) Data Quality ChecksAt this point in the exploratory data analysis, the data has been cleaned and new variables have been created. This next section aims to perform quality checks on the first draft of a final clean dataset. Performing QC checks and taking the time to actual observe the data is crucial. Simple awareness of a dataset's attributes such as column names, missing values, df shape, etc., help identify any inconsistencies, errors, or missing information in the dataset that might impact the outcomes of future analysis. Therefore, the following subsections provide a sample of the data for these types of observations.##### Checking the Names of the Columns```{python}#| eval: Falsejoined_subset.columns```The code above checks the column names; however, please see the schema in section 7 below for the complete list of columns.##### Checking the Number of Rows```{python}#| eval: Falsejoined_subset.count()```114334##### Checking for Nulls```{python}#| eval: Falsejoined_subset.select([count(when(col(c).isNull(), c)).alias(c) for c in joined_subset.columns]).show()```| column | number of nulls ||-----------------------------------|-----------------|| link_id | 8111 || body | 8111 || created_utc_comment | 8111 || is_tech_comments | 8111 || is_asking_for_help_comments | 8111 || is_asking_a\_question_comments | 8111 || is_FAANG_comments | 8111 || id | 934 || subreddit | 934 || subreddit_id | 934 || title | 934 || selftext | 934 || created_utc_submission | 934 || num_comments | 934 || searchable_text | 934 || is_tech_submissions | 934 || is_asking_for_help_submissions | 934 || is_asking_a\_question_submissions | 934 || is_FAANG_submissions | 934 |There are 8,111 rows with NULL in the comment-related columns. This is to be expected, and indicates that there are 8,111 submissions in the dataset that have no comments, and therefore have missing data in the comment-related fields.Similarly, there are 934 rows with NULL in the submission-related columns. This indicates that there are 934 comments that respond to submissions outside of the dataset. This is likely due to the connected submission being posted outside the window of time that this dataset tracked. In any case, there is still interest in these comments and will keep them in the dataset.##### Checking Length of Comments```{python}#| eval: Falsecomment_length = joined_subset.filter(joined_subset.link_id.isNotNull()) .select(length('body').alias('comment_len'), 'body')comment_length.select('comment_len').describe().show()```| summary | comment_len ||---------|-------------|| count | 106223.0 || mean | 190.8 || stddev | 304.1 || min | 1.0 || max | 8183.0 |The distribution of the length of comments seems reasonable. The only result that may raise an eyebrow is the minimum comment length of 1. However, some of the comments are primarily emojis, which contain their own special significance in the world of NLP. For this reason, all of the comments will be kept.##### Removing Corrupted RowsCorrupted rows were filtered out while reading in the data.#### 6) Data ReformattingFinally, the data from above needed to be reformatted so that the text is all in the same column and submissions and comments are concatenated rather than joined. The code below shows this logic, and the table shows the top three rows for a selection of the columns.```{python}#| eval: False%%timeimport sagemakersession = sagemaker.Session()output_prefix_data_submissions ="final_tagged_data.parquet/"s3_path =f"s3a://{bucket}/project/{output_prefix_data_submissions}"print(f"reading tagged data from {s3_path}")df = spark.read.parquet(s3_path, header=True)print(f"shape of the submissions dataframe is {df.count():,}x{len(df.columns)}")import pyspark.sql.functions as Fimport pandas as pdimport datetime# Separate into two dataframes (comments and submissions)df_submissions = df.filter(df.created_utc_submission.isNotNull()) .select( F.col('id').alias('link_id'), F.col('created_utc_submission').alias('created_utc'), F.col('searchable_text').alias('body'), F.col('is_tech_submissions').alias('is_tech'), F.col('is_asking_for_help_submissions').alias('is_asking_for_help'), F.col('is_asking_a_question_submissions').alias('is_asking_a_question'), F.col('is_FAANG_submissions').alias('is_FAANG'), F.lit(True).alias('isSubmission') ) .distinct()print("Number of unique submissions:", df_submissions.count())df_comments = df.filter(df.created_utc_comment.isNotNull()) .select('link_id', F.col('created_utc_comment').alias('created_utc'),'body', F.col('is_tech_comments').alias('is_tech'), F.col('is_asking_for_help_comments').alias('is_asking_for_help'), F.col('is_asking_a_question_comments').alias('is_asking_a_question'), F.col('is_FAANG_comments').alias('is_FAANG'), F.lit(False).alias('isSubmission') ) .distinct()print("Number of unique comments:", df_comments.count())# Concatenate comments and submissionsdf_clean = df_submissions.union(df_comments)df_clean.show(10)```| body | is_tech | is_asking_for_help | is_asking_a\_question | is_FAANG | isSubmission ||----------|----------|----------|----------|----------|----------|| Amazon Inter... | false | false | true | true | true || Coffee in a 2nd i... | false | true | true | false | true || Attire for Coach ... | false | false | true | false | true |#### 7) Final Data Set Information**Interesting Columns:**- link_id- body- created_utc_comment- subreddit- subreddit_id- title- selftext- num_comments**Number of rows:** The shape of the submissions dataframe is 22,122x68 Shape of the comments dataframe is 106,223x21.**Schema:**``` root|-- link_id: string (nullable = true) |-- body: string (nullable = true) |-- created_utc_comment: timestamp (nullable = true) |-- is_tech_comments: boolean (nullable = true) |-- is_asking_for_help_comments: boolean (nullable = true) |-- is_asking_a_question_comments: boolean (nullable = true) |-- is_FAANG_comments: boolean (nullable = true) |-- id: string (nullable = true) |-- subreddit: string (nullable = true) |-- subreddit_id: string (nullable = true) |-- title: string (nullable = true) |-- selftext: string (nullable = true) |-- created_utc_submission: timestamp (nullable = true) |-- num_comments: long (nullable = true) |-- searchable_text: string (nullable = true) |-- is_tech_submissions: boolean (nullable = true) |-- is_asking_for_help_submissions: boolean (nullable = true) |-- is_asking_a_question_submissions: boolean (nullable = true) |-- is_FAANG_submissions: boolean (nullable = true) ```#### 8) External Data Set Preparation**External Data Source:** [link](https://github.com/yuenherny/um-wqd7003-ds-salary-analysis/tree/main)This data set was combined by the author of the GitHub repository above from two sources: LEVELS.FYI API and a Kaggle dataset on data science and stem salaries (see README in repository linked above). The original data set contains yearly compensation (total, base salary, bonuses, and stock grants), location, years of experience, and years at the company information for STEM and data science roles within over 1500 companies. This data ranges from 2017 to 2021.For the project's purposes, the cleaned data set will average yearly compensation, base salary, bonus, years of experience, and years at company for each company and role type (tech or non-tech). From there, subsets can made for particular companies of interest. Additionally, the ability to focus on tech vs. non-tech roles can be easily achieved through filtering. As seen above, the data has been tagged for containing info on the FAANG companies (Facebook, Amazon, Apple, Netflix, and Google). Plot 5 above was created by merging the main data set with this cleaned external data set to allow for a comparison between the Reddit comment frequency for the FAANG companies with the average yearly compensation and average base salaries at these companies.```{python}#| warning: False# Import librariesimport osimport openpyxlimport pandas as pdimport numpy as np# Read in the datacompany_names = pd.read_csv("../data/external_data/company_name_matching_RAW.csv")salaries = pd.read_excel("../data/external_data/levels_fyi_salary_data_RAW.xlsx", sheet_name ="data")# Subset columnssalaries_subset = salaries[["timestamp", "company", "title", "totalyearlycompensation", "location", "yearsofexperience", "yearsatcompany", "basesalary", "stockgrantvalue", "bonus"]]# Add a year column and drop timestamp columnsalaries_subset["year"] = pd.to_datetime(salaries_subset["timestamp"]).dt.yearsalaries_subset = salaries_subset.drop(["timestamp"], axis =1)# Change data typesdata_types = {"company": str, "title": str, "totalyearlycompensation": float, "location": str, "yearsofexperience": float, "yearsatcompany": float, "basesalary": float, "stockgrantvalue": float, "bonus": float, "year": int}salaries_subset = salaries_subset.astype(data_types)salaries_subset["year"] = pd.to_datetime(salaries_subset["year"], format="%Y")# Create clean company name matchingcompany_mapping =dict(zip(company_names["Variant"].str.strip(), company_names["Clean Company"]))# Make a new column with the clean company namessalaries_subset = salaries_subset.rename(columns = {"company": "old_company"})salaries_subset["company"] = salaries_subset["old_company"].map(company_mapping)salaries_subset = salaries_subset.drop(["old_company"], axis =1)# Categorize available titles as "tech" or "non tech"role_type_dict = {'Product Manager': 'tech', 'Software Engineer': 'tech','Software Engineering Manager': 'tech', 'Data Scientist': 'tech','Solution Architect': 'tech', 'Technical Program Manager': 'tech','Human Resources': 'non tech', 'Product Designer': 'tech', 'Marketing': 'non tech','Business Analyst': 'tech', 'Hardware Engineer': 'tech', 'Sales': 'non tech', 'Recruiter': 'non tech', 'Mechanical Engineer': 'tech', 'Management Consultant': 'non tech'}salaries_subset["role_type"] = salaries_subset["title"].map(role_type_dict)# Rearrange columnssalaries_subset = salaries_subset[["company", "year", "role_type", "title", "totalyearlycompensation", "location", "yearsofexperience","yearsatcompany", "basesalary", "stockgrantvalue", "bonus"]]# Get a summary table of averages by company and role typesummary_df = salaries_subset.groupby(["company", "role_type"]).agg({"totalyearlycompensation": "mean", "yearsofexperience": "mean","yearsatcompany": "mean", "basesalary": "mean","stockgrantvalue": "mean", "bonus": "mean"}).reset_index()summary_df.columns = ["company", "role_type", "average_yearly_compensation", "average_years_experience", "average_years_at_company", "average_base_salary", "average_stock_grant_value", "average_bonus"]# Subset for just FAANG (Facebook, Amazon, Apple, Netflix, Google)faang_df = summary_df[(summary_df["company"] =="Facebook") | (summary_df["company"] =="Amazon") | (summary_df["company"] =="Apple") | (summary_df["company"] =="Netflix") | (summary_df["company"] =="Google")]summary_df.head(20)#faang_df.head(20)```### Summary TablesAfter conducting the necessary quality checks on the dataset, a summary of the information through different perspectives to enhance the team's overall understanding of the data. This approach allows for a more comprehensive analysis and interpretation of the dataset's characteristics and trends.#### Table 1: Summary Of Regex SearchesThe following table shows which regex searches performed. For certian submissions/comments several regex searches can be true at the same time. Only the first 8 rows are printed for demonstration.```{python}#| eval: Falsedf.select('link_id', 'body', 'is_tech_comments', 'is_asking_for_help_comments','is_asking_a_question_comments','is_FAANG_comments').show(20,True)```| link_id | body | is_tech_comments | is_asking_for_help_comments | is_asking_a\_question_comments | is_FAANG_comments ||------------|------------|------------|------------|------------|------------|| t3_1004fo3 | I mean this in a… | false | false | false | false || t3_1004fyy | Dark mode… | false | false | false | false || t3_1004fyy | Leetcode does… | true | false | false | false || t3_1005b4u | Ok that’s what I… | false | false | true | false || t3_1005b4u | This, since it’s… | false | false | false | false || t3_1005b4u | Well the total ru… | false | false | false | false || t3_1005b4u | O(n\^2) | false | false | false | false || t3_1005e3k | In my opinion… | false | false | false | false |#### Table 2: New Variables TableThe table below provides on overview of the new variables created. It focuses on the mentions of FAANG companies in the comments. Since this website's focus is on technical interviews, this allows the team to separate 'the big guns' on the market from the rest. It is important to note that there are other companies that could be included, but in order the narrow down the search, FAANG alone was chosen.```{python}#| eval: Falsedf.select('link_id', 'body','is_FAANG_comments','Facebook', 'Amazon', 'Apple', 'Netflix', 'Google', 'Multiple').show(20,True)```| link_id | body | is_FAANG_comments | Facebook | Amazon | Apple | Netflix | Google | Multiple ||--------|--------|--------|--------|--------|--------|--------|--------|--------|| t3_1005e3k | not to discount… | true | false | true | false | false | false | false || t3_1005e3k | i am aware that… | true | false | true | false | false | true | true || t3_1005e3k | you must mean… | true | false | false | true | false | false | false || t3_1005e3k | i had around… | true | false | true | false | false | false | false || t3_1005e3k | contest ratings… | true | false | true | false | false | false | false || t3_1005e3k | i also have 550… | true | false | true | false | false | true | true || t3_1005e3k | i’ve interviewed… | true | false | true | false | false | true | true || t3_1005e3k | thanks. when… | true | false | true | false | false | false | false || t3_100ivcc | lesson 1: google… | true | false | false | false | false | true | false || t3_100wpsk | hey, just want… | true | false | true | false | false | false | false |#### Table 3: Frequency Counts for Regex SearchesSince there are significantly more comments than submissions, a summary of the frequency counts for each of the regex searches has been formatted in a table.```{python}#| eval: False# Table 3frequency_is_tech_comments = df.groupBy('is_tech_comments').count()frequency_is_asking_for_help_comments = df.groupBy('is_asking_for_help_comments').count()frequency_is_asking_a_question_comments = df.groupBy('is_asking_a_question_comments').count()frequency_is_FAANG_comments = df.groupBy('is_FAANG_comments').count()frequency_is_tech_comments.show()frequency_is_asking_for_help_comments.show()frequency_is_asking_a_question_comments.show()frequency_is_FAANG_comments.show()```| regex | True | False ||--------------------------------|-------|--------|| is_tech_comments | 20955 | 85268 || is_asking_for_help_comments | 8969 | 97254 || is_asking_a\_question_comments | 21703 | 84520 || is_FAANG_comments | 3797 | 102426 |### VisualizationsIn the section below, topics specifically relating to EDA will be explore. The visualizations are broken down into each of the three topics.#### TOPIC 1: INTERVIEW POST AND COMMENT FREQUENCY OVER TIME*Goal:* Determine the time periods throughout the year with the most submissions (posts) and comments on Reddit regarding technical/coding interviews. Do these windows fall during typical hiring windows? This line of analysis could explain spikes or troughs in job application volume in the big tech industry.The line graph below illustrates the monthly frequency of submissions and comments over a span of three years (2021, 2022, and 2023) emphasizing user interview engagement trends in Reddit. There is a year-over-year increase, likely influenced by post-COVID interest in technology sectors like NFTs and AI. The peak in 2022 around late summer coincides with common hiring cycles, whereas the consistent 2021 data may reflect the erratic job market during COVID-19. Data up to August 2023 suggests an ongoing rise in engagement, indicative of either growing user participation or platform expansion.```{python}#| eval: False# Plot 1import sagemakersession = sagemaker.Session()bucket = session.default_bucket()output_prefix_data_submissions ="project/submissions/yyyy=*"s3_path =f"s3a://{bucket}/{output_prefix_data_submissions}"#print(f"reading comments from {s3_path}")submissions = spark.read.parquet(s3_path, header=True)#print(f"shape of the comments dataframe is {submissions.count():,}x{len(submissions)from pyspark.sql.functions import year, monthimport matplotlib.pyplot as plt# Extract year and month from the 'created_utc' columnsub_df_with_month = submissions.withColumn("year", year("created_utc")).withColumn("month", month("created_utc"))# Group the data by year and month and count the number of commentssub_counts = sub_df_with_month.groupBy("year", "month").count().orderBy("year", "month").cache()# Convert the result to a Pandas DataFrame for easier plottingsub_counts_pd = sub_counts.toPandas()%%timeimport sagemakersession = sagemaker.Session()bucket = session.default_bucket()output_prefix_data_comments ="project/comments/yyyy=*"s3_path =f"s3a://{bucket}/{output_prefix_data_comments}"#print(f"reading comments from {s3_path}")comments = spark.read.parquet(s3_path, header=True)#print(f"shape of the comments dataframe is {comments.count():,}x{len(comments.columns)}")from pyspark.sql.functions import year, monthimport matplotlib.pyplot as plt# Extract year and month from the 'created_utc' columncomm_df_with_month = comments.withColumn("year", year("created_utc")).withColumn("month", month("created_utc"))# Group the data by year and month and count the number of commentscomment_counts = comm_df_with_month.groupBy("year", "month").count().orderBy("year", "month").cache()# Convert the result to a Pandas DataFrame for easier plottingcomment_counts_pd = comment_counts.toPandas()import pandas as pdcombined_df_pd = pd.merge(sub_counts_pd, comment_counts_pd, on=['year', 'month'], how='outer', suffixes=('_submissions', '_comments'))#combined_df_pd = combined_df_pd.fillna(0)import calendar# Filter the data for each yeardata_2021 = combined_df_pd[combined_df_pd['year'] ==2021]data_2022 = combined_df_pd[combined_df_pd['year'] ==2022]data_2023 = combined_df_pd[combined_df_pd['year'] ==2023]# Convert numeric months to month namesdata_2021['month'] = data_2021['month'].apply(lambda x: calendar.month_name[x])data_2022['month'] = data_2022['month'].apply(lambda x: calendar.month_name[x])data_2023['month'] = data_2023['month'].apply(lambda x: calendar.month_name[x])# Create a line plot with month names on the x-axis and a separate line for each yearplt.figure(figsize=(10, 6))plt.plot(data_2021['month'], data_2021['count_submissions'], marker='o', linestyle='-', label='Submissions 2021', color='#204321')plt.plot(data_2022['month'], data_2022['count_submissions'], marker='o', linestyle='-', label='Submissions 2022', color='#5E9751')plt.plot(data_2023['month'], data_2023['count_submissions'], marker='o', linestyle='-', label='Submissions 2023', color='#82B8B5')plt.plot(data_2021['month'], data_2021['count_comments'], marker='o', linestyle='dotted', label='Comments 2021', color='#163D6B')plt.plot(data_2022['month'], data_2022['count_comments'], marker='o', linestyle='dotted', label='Comments 2022', color='#4A80EB')plt.plot(data_2023['month'], data_2023['count_comments'], marker='o', linestyle='dotted', label='Comments 2023', color='#251279')plt.xlabel('Month')plt.ylabel('Number of Submissions & Comments')plt.title('Submissions & Comments Over Time by Year')plt.xticks(rotation=45) # Rotate x-axis labels for readabilityplt.grid(False)plt.legend()plt.tight_layout()plt.savefig('../data/plots/sub_com_over_time.png', dpi=300) plt.show()```<!-- 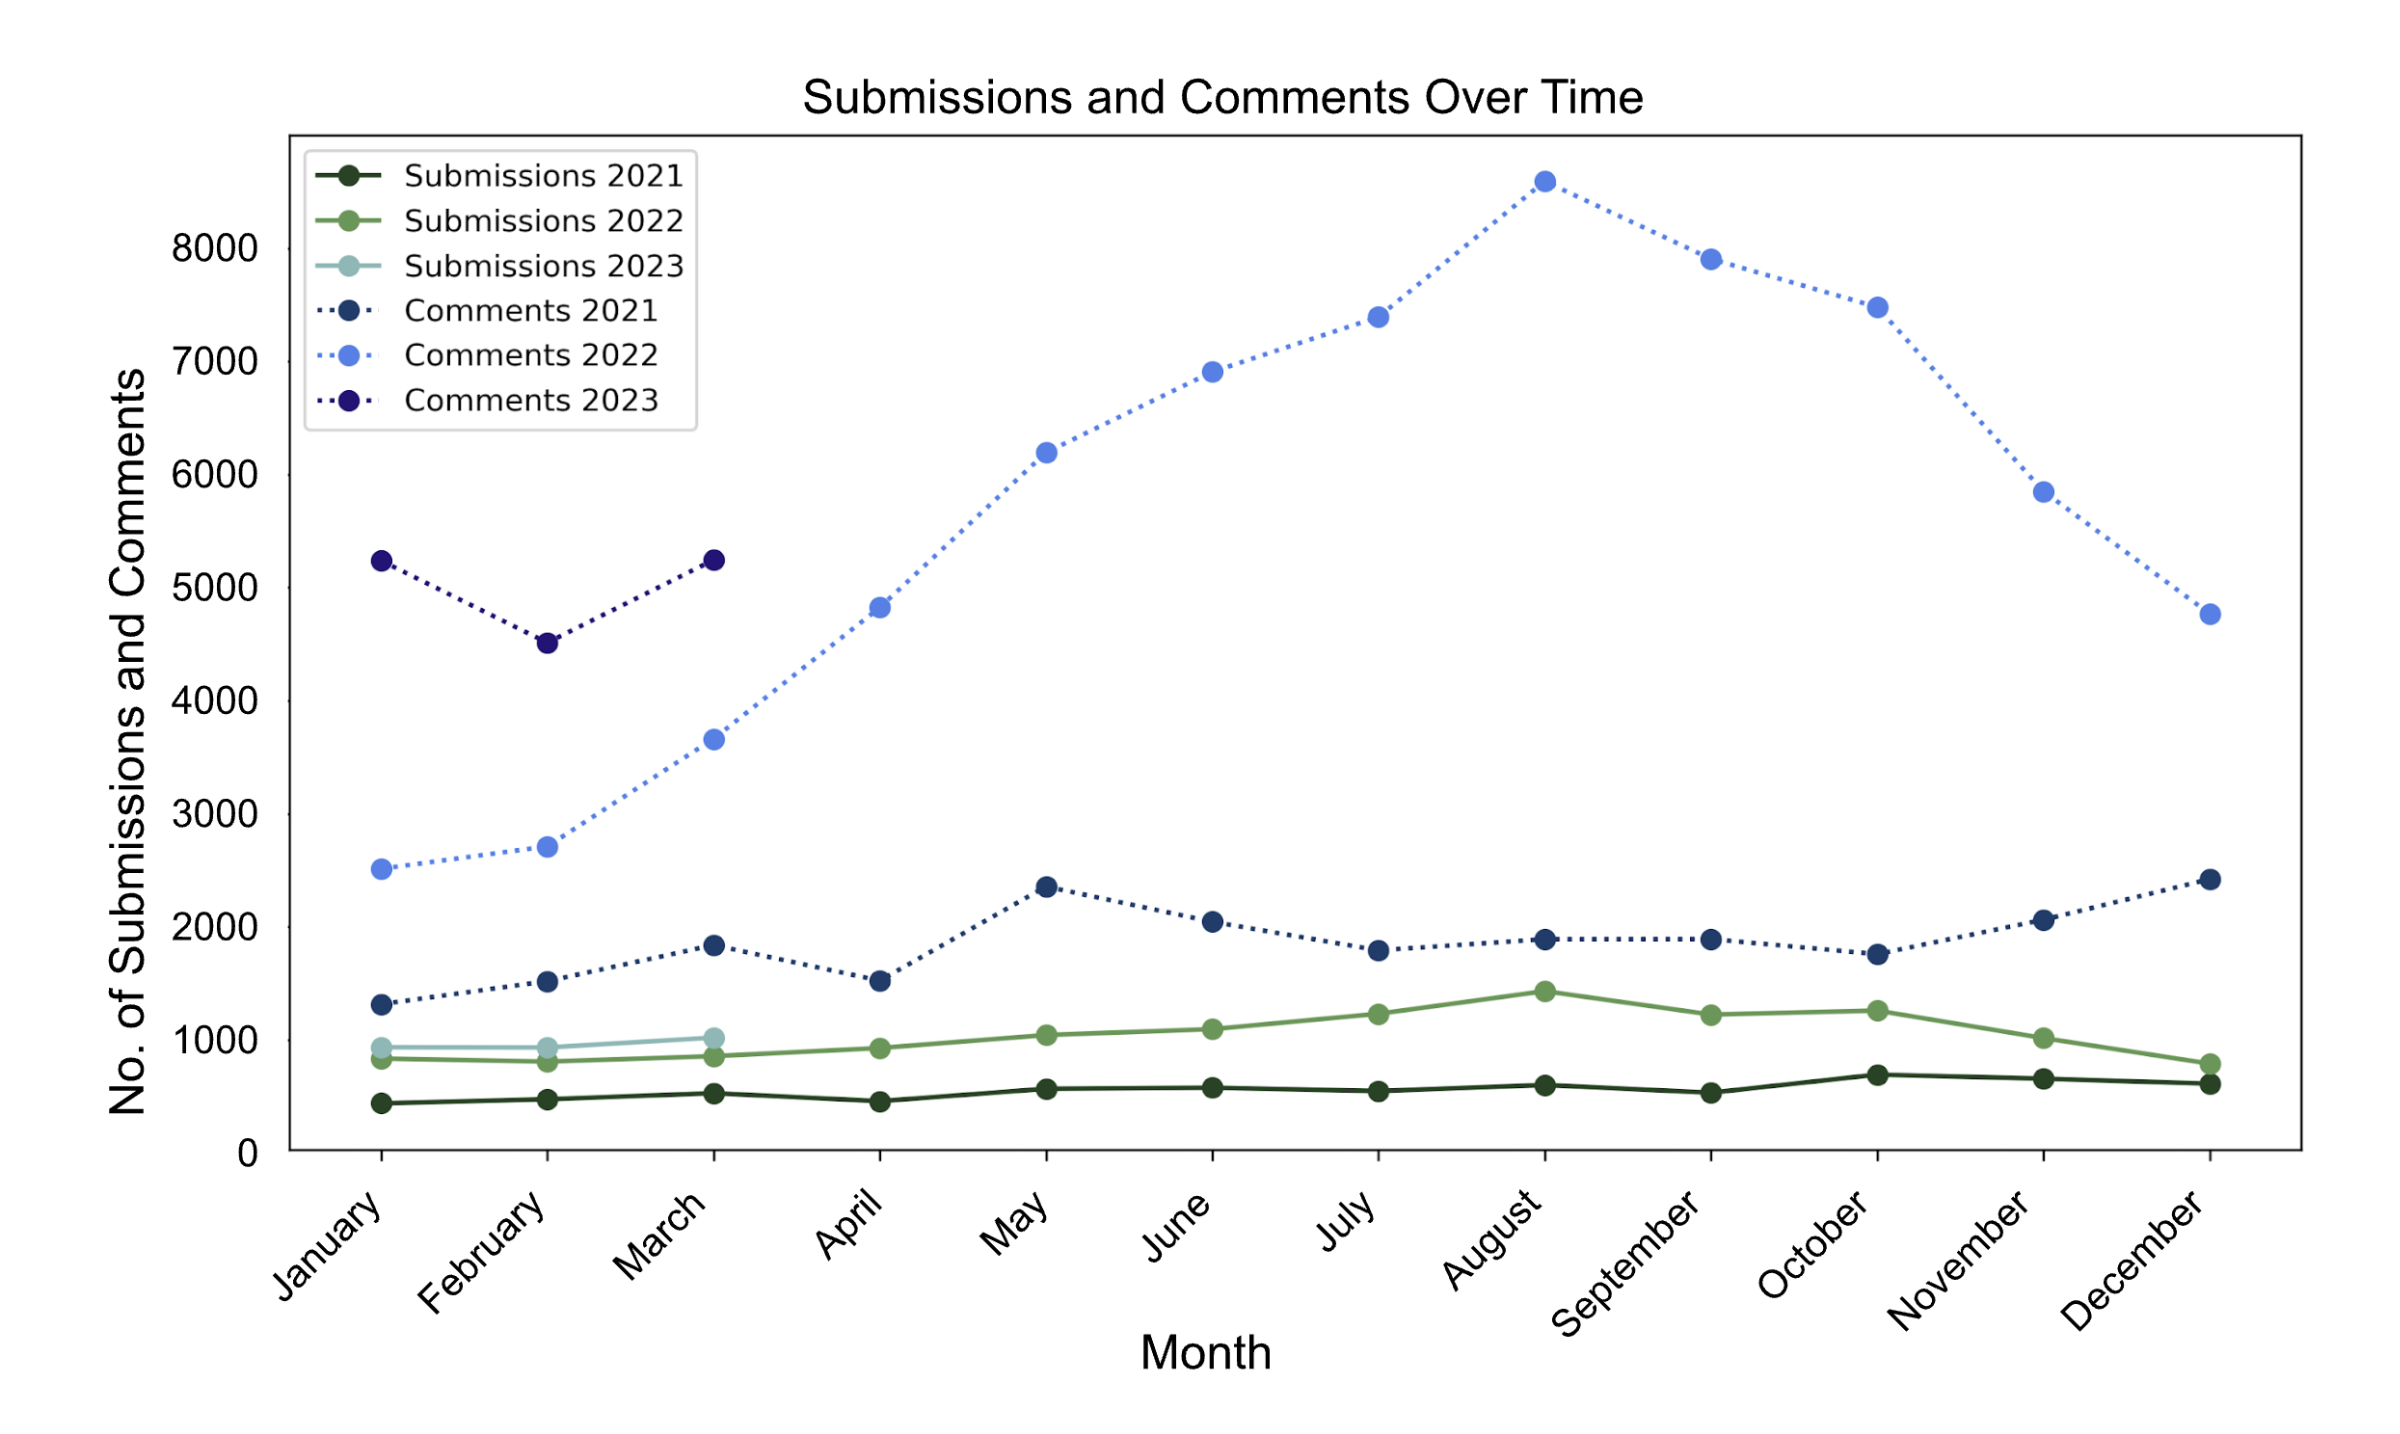 --><imgsrc="images/sub_com_over_time.png"style="width: 80%; height: auto;"/>#### TOPIC 2: POPULAR TECHNICAL INTERVIEW QUESTIONS AND TOPICS*Goal:* Determine the most popular interview questions and/or topics to gauge the specific areas of interest regarding technical and coding-related interviews. Questions that are being discussed more frequently can help future applicants streamline how they study for interviews to focus on the topics with the most traction on Reddit. Highlighting content matter that’s seen most frequently can direct students in their studying.The wordcloud below was created using the body column in the dataset. The body column has all the text from the reddits and subreddits. Since the focus is on both submissions and comments, the two datasets were joined together to make sure all the text to produce an accurate wordcloud were extracted. The text was additionally tokenized to produce a tokens, and all stopwords and special characters have been removed. Finally the vocabulary was flattened and the wordcloud was created from said flattened vocabulary.```{python}#| eval: False# Plot 2# get WordCloud library!pip install matplotlib wordcloud# import librariesfrom pyspark.sql.functions import col, lower, regexp_replace, array_except, array, lit, whenfrom pyspark.ml.feature import Tokenizer, StopWordsRemoverfrom pyspark.sql import functions as Ffrom wordcloud import WordCloudimport matplotlib.pyplot as pltfrom PIL import Imageimport numpy as np# preprocess the text: clean up, tokenize, and remove stop words# make text lowercase, and remove special charactersdf_clean = df.withColumn('body', lower(col('body'))) .withColumn('body', regexp_replace('body', "[^a-zA-Zs]", "")) .withColumn('body', regexp_replace('body', "bw{1,2}b", ""))# tokenize texttokenizer = Tokenizer(inputCol="body", outputCol="words")# transform tokenized textdf_words = tokenizer.transform(df_clean)# remove stopwrodsremover = StopWordsRemover(inputCol="words", outputCol="filtered")df_filtered = remover.transform(df_words)#remove empty stringsempty_string_array = array(lit(''))df_filtered = df_filtered.withColumn("filtered", array_except(col("filtered"), empty_string_array))#flatten the vocabulary listwords_list = df_filtered.select('filtered').rdd.flatMap(lambda x: x).collect()flat_list = [word for sublist in words_list for word in sublist]# join the list to a single string, as wordcloud takes a string as inputword_string =" ".join(flat_list)# adjust figure sizewordcloud = WordCloud(width=1600, height=800, collocations=True, background_color='white').generate(word_string)plt.figure(figsize=(20, 10), dpi=300) plt.imshow(wordcloud, interpolation='bilinear')plt.axis("off")plt.show()```<!-- 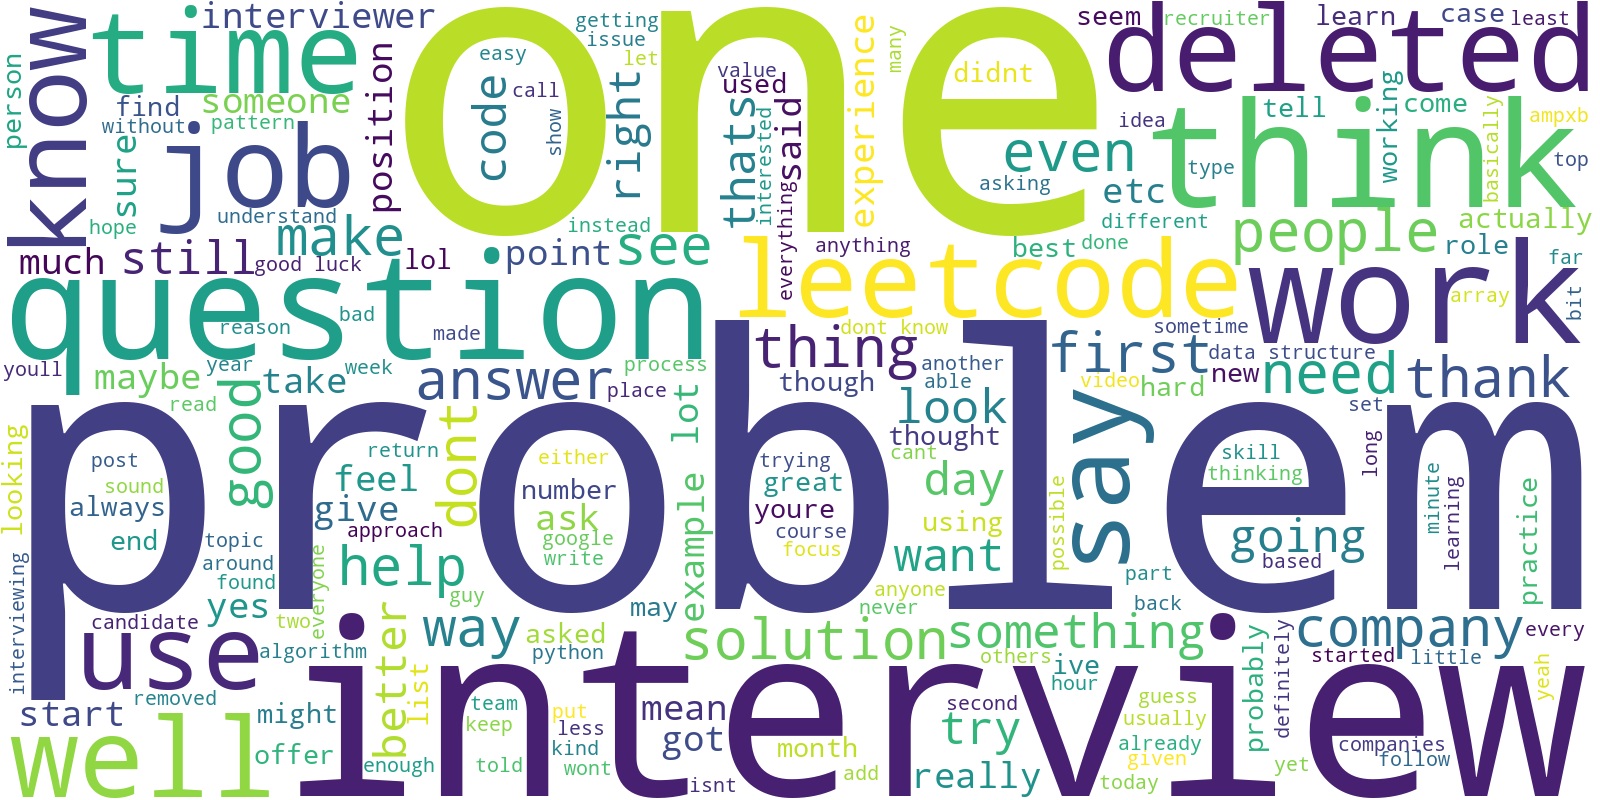 --><imgsrc="images/high_resolution_wordcloud_updated.png"style="width: 75%; height: auto;"/>In the word cloud above, the most prominent words are ‘one’, ‘problem’, and ‘interview’; this is absolutely expected based on the fact that the Reddit posts are focused asking questions about technical interviews. The most significant term observed here is ‘LeetCode’ because it indicates a focus on coding or technical interviews, as LeetCode is a platform that provides coding challenges for such purposes. This suggests that the Reddit posts have a strong representation of technical and coding questions, with potential sources or solutions on the LeetCode website. This supports the decision to carry out a regex search for technical Reddit posts.This next plot illustrates the percent of comments and/or submissions in the dataset that pose questions. Submissions and comments were identified as posing a question with a simple regex search that matched a question mark (?) character. In a casual forum like Reddit, it is expected to miss a few questions in which users forget to add a question mark, but the examination of the dataset showed that the accuracy of this regex match was adequately reliable.```{python}#| eval: False# Question countsimport pyspark.sql.functions as Fimport pandas as pdimport datetime# Add date columndf_time = df.withColumn("monthyear", F.concat( F.month("created_utc"), F.lit('-'), F.year("created_utc") ))# Question countsdf_question_counts = df_time.filter('is_asking_a_question').groupBy('monthyear').count()# Submission/comment countsdf_total_counts = df_time.groupBy('monthyear')\ .count()\ .select(F.col('monthyear').alias('monthyear2'), F.col('count').alias('total_count'))# Convert to pandas dataframepd_df1 = df_question_counts.join( df_total_counts, df_question_counts.monthyear == df_total_counts.monthyear2, 'left').select('monthyear', 'count', 'total_count').toPandas()# Reorder pandas dataframepd_df1['month'] = pd_df1['monthyear'].apply(lambda x: int(x.split('-')[0]))pd_df1['year'] = pd_df1['monthyear'].apply(lambda x: int(x.split('-')[1]))pd_df1 = pd_df1.sort_values(['year', 'month']).reset_index(drop=True)# Add ratio of questions to all posts as new columnpd_df1['pct_questions'] = pd_df1['count'] / pd_df1['total_count'] *100pd_df1.head()# Get question counts for submissions# Question countsdf_question_counts_sub = df_time.filter('is_asking_a_question').filter('isSubmission').groupBy('monthyear').count()# Submission/comment countsdf_sub_counts = df_time.filter('isSubmission')\ .groupBy('monthyear')\ .count()\ .select(F.col('monthyear').alias('monthyear2'), F.col('count').alias('total_count'))# Convert to pandas dataframepd_df_sub = df_question_counts_sub.join( df_sub_counts, df_question_counts_sub.monthyear == df_sub_counts.monthyear2, 'left').select('monthyear', 'count', 'total_count').toPandas()# Reorder pandas dataframepd_df_sub['month'] = pd_df_sub['monthyear'].apply(lambda x: int(x.split('-')[0]))pd_df_sub['year'] = pd_df_sub['monthyear'].apply(lambda x: int(x.split('-')[1]))pd_df_sub = pd_df_sub.sort_values(['year', 'month']).reset_index(drop=True)# Add question ratio as new columnpd_df_sub['pct_questions'] = pd_df_sub['count'] / pd_df_sub['total_count'] *100# Get question counts for comments# Question countsdf_question_counts_com = df_time.filter('is_asking_a_question')\ .filter(F.col('isSubmission') ==False)\ .groupBy('monthyear')\ .count()# Submission/comment countsdf_com_counts = df_time.filter(F.col('isSubmission') ==False)\ .groupBy('monthyear')\ .count()\ .select(F.col('monthyear').alias('monthyear2'), F.col('count').alias('total_count'))# Convert to pandas dataframepd_df_com = df_question_counts_com.join( df_com_counts, df_question_counts_com.monthyear == df_com_counts.monthyear2, 'left').select('monthyear', 'count', 'total_count').toPandas()# Reorder pandas dataframepd_df_com['month'] = pd_df_com['monthyear'].apply(lambda x: int(x.split('-')[0]))pd_df_com['year'] = pd_df_com['monthyear'].apply(lambda x: int(x.split('-')[1]))pd_df_com = pd_df_com.sort_values(['year', 'month']).reset_index(drop=True)# Add question ratio as new columnpd_df_com['pct_questions'] = pd_df_com['count'] / pd_df_com['total_count'] *100# Line plotplt.figure(figsize=(10, 6))# Plot aggregated question percentplt.plot( pd_df1['monthyear'], pd_df1['pct_questions'], color='#204321', marker='o', linestyle='-', label="Combined (all posts)")# Plot submission question percentplt.plot( pd_df_sub['monthyear'], pd_df_sub['pct_questions'], color='#5E9751', marker='o', linestyle='dotted', label="Submissions")# Plot comment question percentplt.plot( pd_df_com['monthyear'], pd_df_com['pct_questions'], color='#82B8B5', marker='o', linestyle='dotted', label="Comments")# Annotateplt.xlabel('Month')plt.ylabel('Percent of Total Submissions/Comments')plt.title('Questions as a Percent of Total Submissions/Comments Over Time')plt.xticks(rotation=45) plt.ylim(0, 100)plt.grid(False)plt.legend()plt.tight_layout()plt.savefig('../../website-source/images/question_pcts.png', dpi=300)plt.show()```<!-- 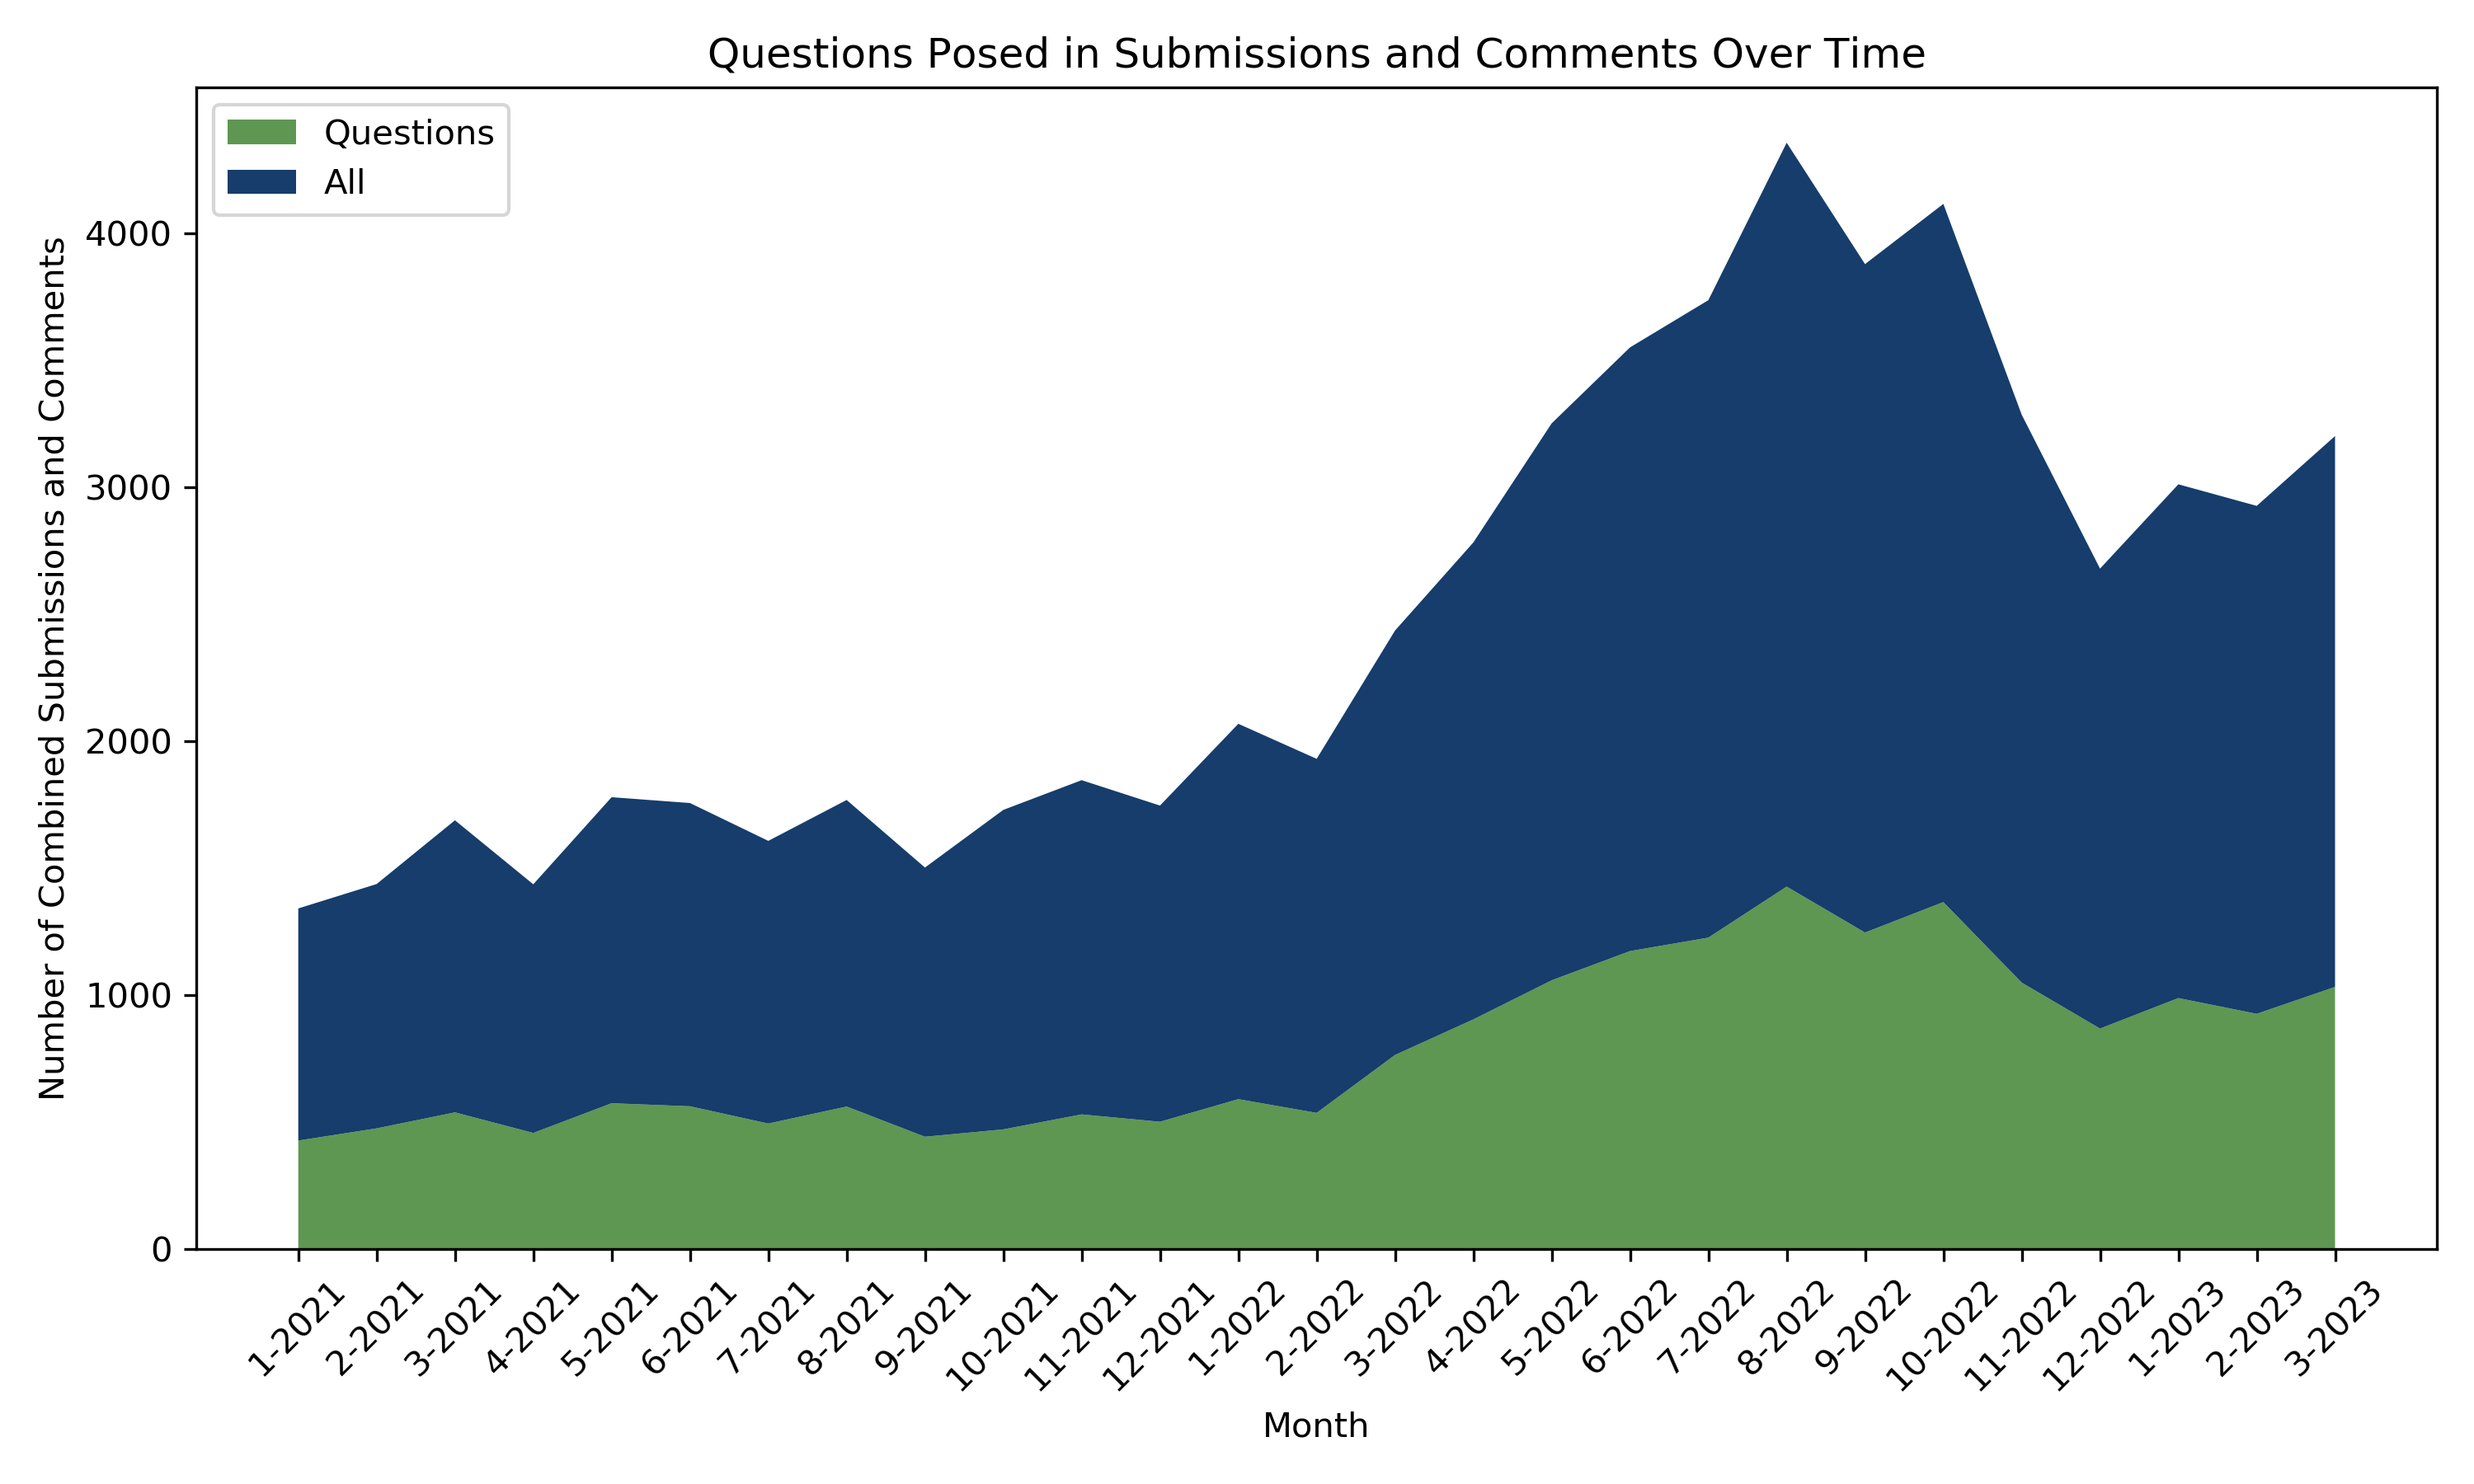 --><imgsrc="images/question_pcts.png"style="width: 80%; height: auto;"/>In the plot above, it's clear from the solid line that the percent of questions out of all comments and submissions (combined) is roughly constant at about 35% over time. This line suggests that the dataset is primarily comprised of Q&A-type discourse, in which roughly 35% of posts ask questions and the other 65% of posts include (but may not be limited to) direct answers to these questions. This follows the general trend of most Q&A-based Reddit communities, where a user asks a question in the form of a submission, and usually *several* users respond in the form of comments.The two dotted lines in the plot seem to confirm this pattern, showing that only about 30% of comments consist of questions (presumably in the form of follow-up questions to the submission) while the remainder of comments likely express statements of fact or opinion that respond to the question posed in the submission. Although the percentage of comments posing questions remains constant over time, the plot shows that the percentage of submissions that pose questions is more volatile. For most of the time, roughly 60% of all submissions in the data pose questions. But from the Fall of 2021 and into the Spring of 2022, the percentage of submissions that pose questions drops to about 40%. Based on the plot in Topic 1, this change in question percentage does not clearly coincide with a change in submission frequency. This suggests that the number of submissions is constant over this time period, but users are posting fewer questions. This sudden drop and rise in questions could be due to a number of possible factors, such as hiring freezes following the COVID-19 hiring surge, changes in subreddit moderator activity, or even random chance associated with smaller sample sizes (there are roughly 500 submissions per month, while comments per month are consistently in the thousands). Regardless of the reason behind this temporary drop in questions, the plot shows that, by and large, the percentage of questions over time is generally constant.#### TOPIC 3: FAANG COMPANY BREAKDOWN*Goal:* FAANG is an acronym that refers to five of the largest and most influential tech companies in the world: Facebook, Apple, Amazon, Netflix, and Google. Consequently, these companies are often seeking many skilled data scientists and analysts. Observe the data related to the frequency with which these companies are mentioned in posts and comments so individuals can gauge their prevalence in discussions related to job interviews in the tech industry. Use an external dataset containing salary information for each FAANG company to enable insight into how public interest in these companies correlates with compensation.The bar plot below was created using the new variable, which was created using a regex search - is_FANNG_comments. All comments were searched and times when one of the FAANG companies (Facebook, Amazon, Apple, Netflix, Google) were been mentioned have been idenfitied. For this plot, there was a desire to look at the frequency of comments that include the mentions of FAANG versus the frequency of comments that don't mention it at all. For that reason a bar plot was chosen to show the team how many comments mention FAANG and how many do not. As expected, there are significantly more comments that do not mention any of the FAANG companies. In fact, the comments that do include FAANG mentions make up only less than 4% of the comments data set.```{python}#| eval: False# Plot 3# make a copy of datadf_faang = df#select columns of interestdf_faang = df_faang.select("link_id", "body", "is_tech_comments", "is_asking_for_help_comments","is_asking_a_question_comments", "is_FAANG_comments")# group by 'is_FAANG_comments' and count each groupfaang_comments_freq = df_faang.groupBy("is_FAANG_comments").count()# collect the data to the driverfaang_comments_data = faang_comments_freq.collect()# prepare the data for plottinglabels = [str(row['is_FAANG_comments']) for row in faang_comments_data] # Convert boolean to string for labelscounts = [row['count'] for row in faang_comments_data]# plot the data using matplotlibfig, ax = plt.subplots(dpi=300)bars = ax.bar(labels, counts, color=['#40B389', '#4A80EB'])# add title and labels to the plotax.set_title('Frequency of FAANG Comments')ax.set_xlabel('Has a Mention of FAANG')ax.set_ylabel('Frequency')# set the x-ticks to correspond to the labelsax.set_xticks([0, 1], labels)# annotate the height of each barfor bar in bars: height = bar.get_height() ax.annotate('{}'.format(height), xy=(bar.get_x() + bar.get_width() /2, height), xytext=(0, 1), # 3 points vertical offset textcoords="offset points", ha='center', va='bottom')# show the plotplt.show()```<!-- 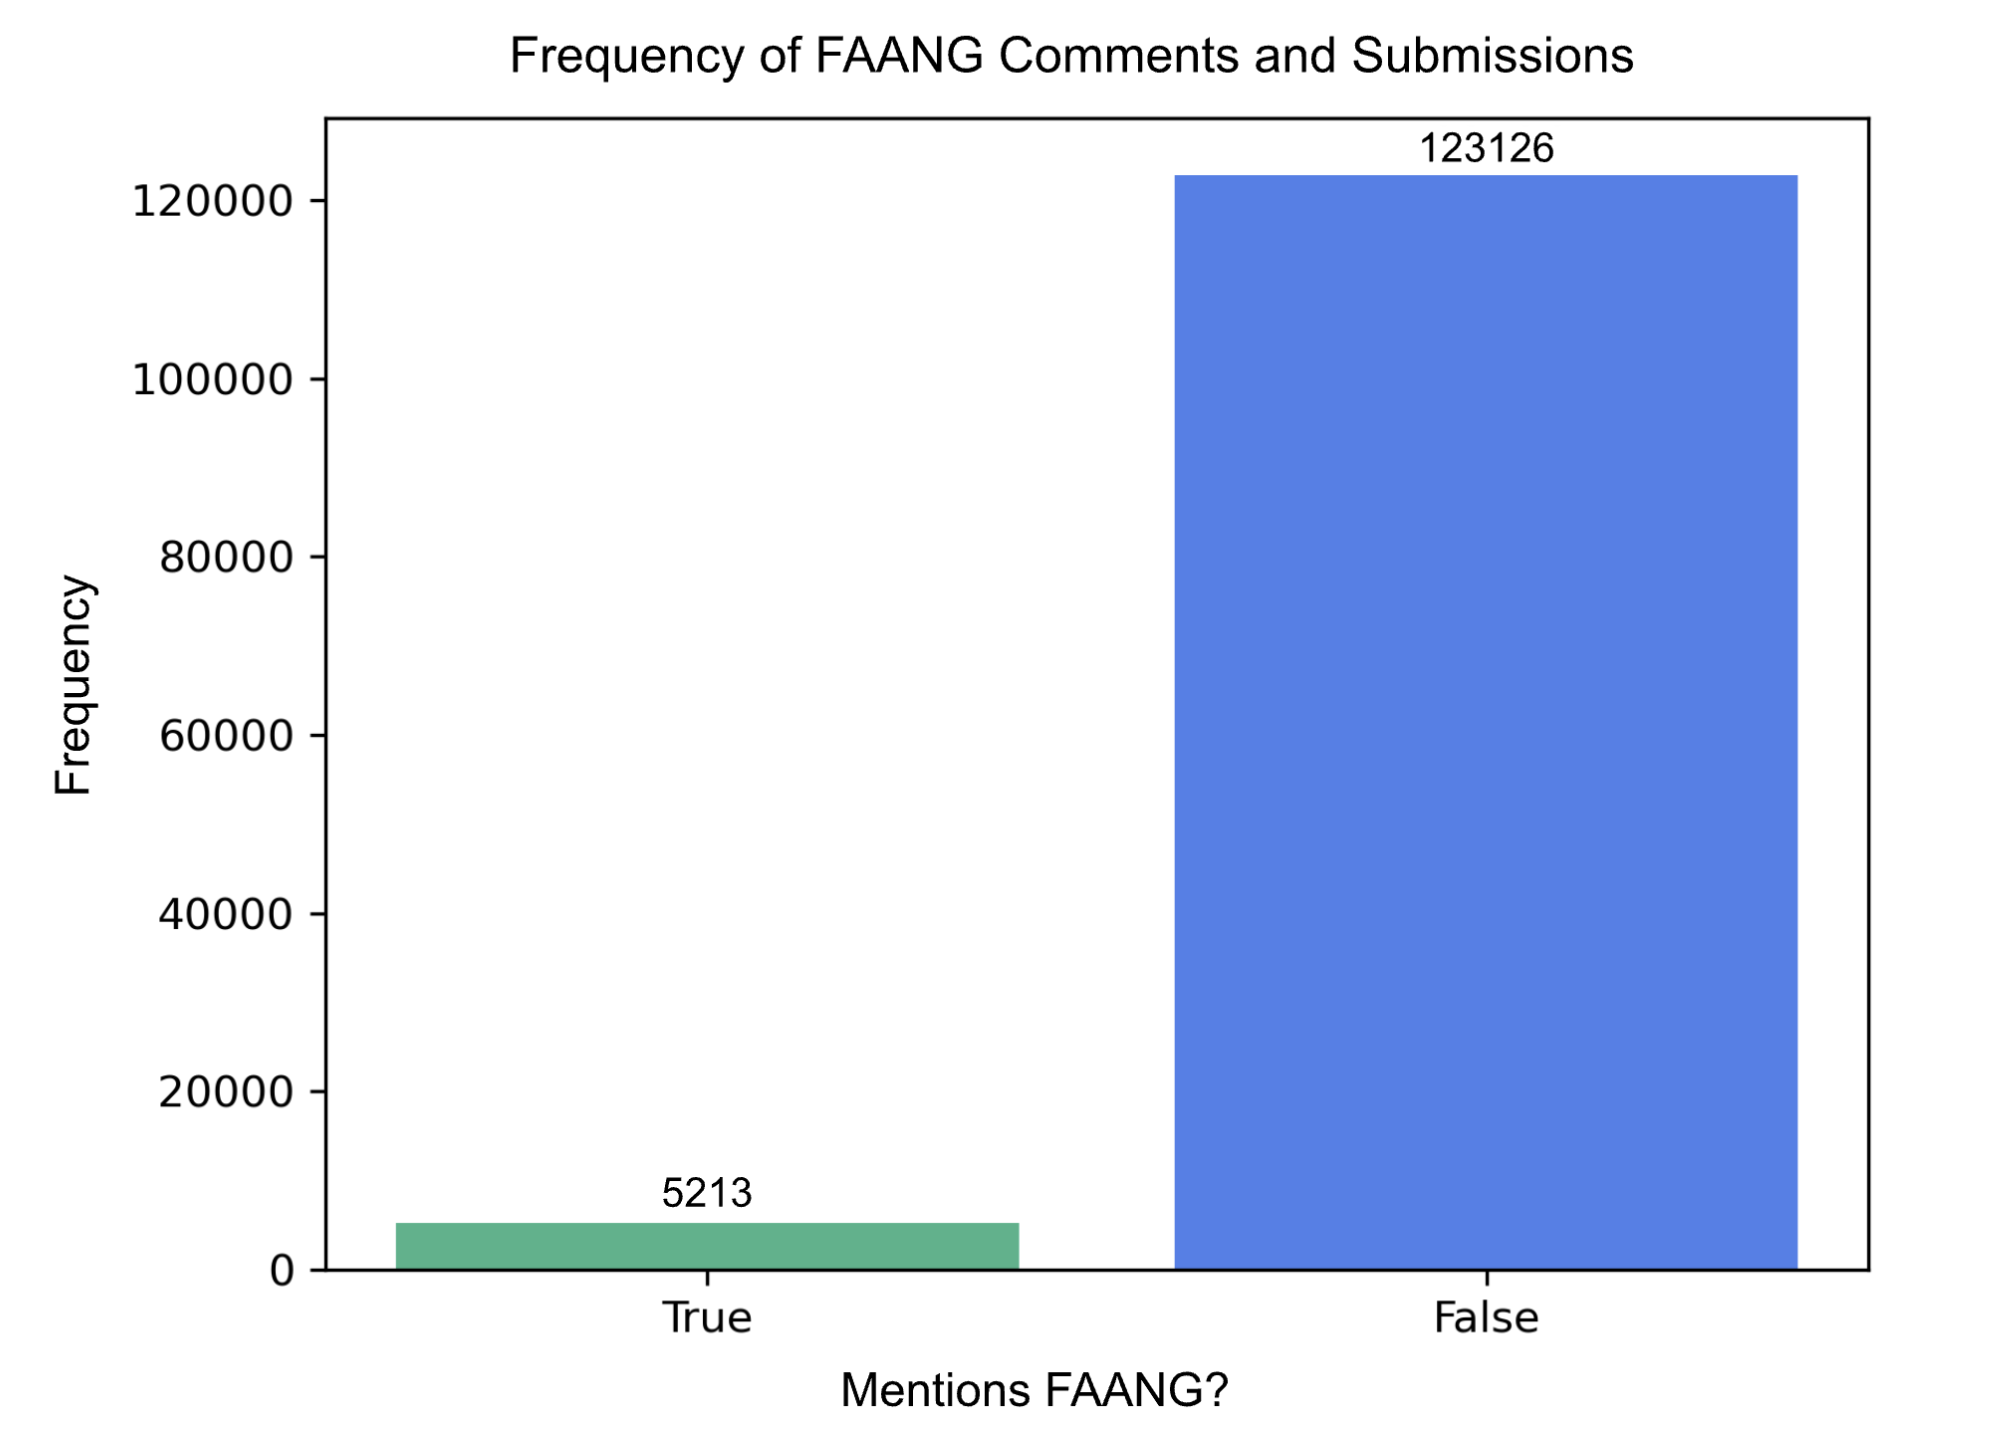 --><imgsrc="images/faang_frequency.png"style="width: 70%; height: auto;"/>The following plot is a direct extension of the previous plot. With this plot, the focus is on all the comments that were tagged as true for is_FAANG_comment. Next, the goal was to observe the divide in frequency between the number of times each of the FAANG companies are mentioned. Therefore, 5 bars were created - each for one of the companies (Facebook, Amazon, Apple, Netflix, Google), and additionally also included a bar for muliple compnaies mentions. The multiple variable accounts for all cases where two or more of the FAANG companies were mentioned in one comment. From the visual, Google has been mentioned significantly more than the other companies. On the other hand, Netflix was hardly ever mentioned. The hypothesis is that it because Netflix as a streming platform requires very specific typle of skills, while for the other companies the skills are more general.```{python}#| eval: False# Plot 4#get only rows where is_FAANG_comments == Truedf_FAANG_True = df_faang.filter(df_faang.is_FAANG_comments ==True)#select columns of interestdf_FAANG_True = df_FAANG_True.select("link_id","body","is_FAANG_comments")#make all text lowercasedf_FAANG_True= df_FAANG_True.withColumn("body", lower(col("body")))#add new columns based on companydf_new_faang = df_FAANG_True.withColumn("Facebook", when(col("body").like("%facebook%"), True).otherwise(False)) .withColumn("Amazon", when(col("body").like("%amazon%"), True).otherwise(False)) .withColumn("Apple", when(col("body").like("%apple%"), True).otherwise(False)) .withColumn("Netflix", when(col("body").like("%netflix%"), True).otherwise(False)) .withColumn("Google", when(col("body").like("%google%"), True).otherwise(False)) .withColumn("Multiple", when((col("body").like("%facebook%") & col("body").like("%amazon%")) | (col("body").like("%facebook%") & col("body").like("%apple%")) | (col("body").like("%facebook%") & col("body").like("%netflix%")) | (col("body").like("%facebook%") & col("body").like("%google%")) | (col("body").like("%amazon%") & col("body").like("%apple%")) | (col("body").like("%amazon%") & col("body").like("%netflix%")) | (col("body").like("%amazon%") & col("body").like("%google%")) | (col("body").like("%apple%") & col("body").like("%netflix%")) | (col("body").like("%apple%") & col("body").like("%google%")) | (col("body").like("%netflix%") & col("body").like("%google%")),True).otherwise(False))faang_sums = df_new_faang.select( [F.sum(F.col(c).cast("int")).alias(c) for c in ['Facebook', 'Amazon', 'Apple', 'Netflix', 'Google', 'Multiple']]).collect()[0].asDict()#define a list of colors for the barscolors = ['#5E9751', '#40B389', '#251279', '#6CACED', '#82B8B5', '#4A80EB']#make sure we have as many colors as we have companiesassertlen(colors) ==len(faang_sums.keys()), "Number of colors must match the number of companies"#create a bar plot with the specified colorsplt.figure(dpi=300 )plt.bar(faang_sums.keys(), faang_sums.values(), color=colors)#add titles and labelsplt.title('Frequency of FAANG Mentions')plt.xlabel('Company')plt.ylabel('Frequency')plt.xticks(rotation=45)#add value labels on top of each barfor i, (key, value) inenumerate(faang_sums.items()): plt.text(i, value, str(value), ha='center', va='bottom', color='black')#show the plotplt.tight_layout()plt.show()```<!-- 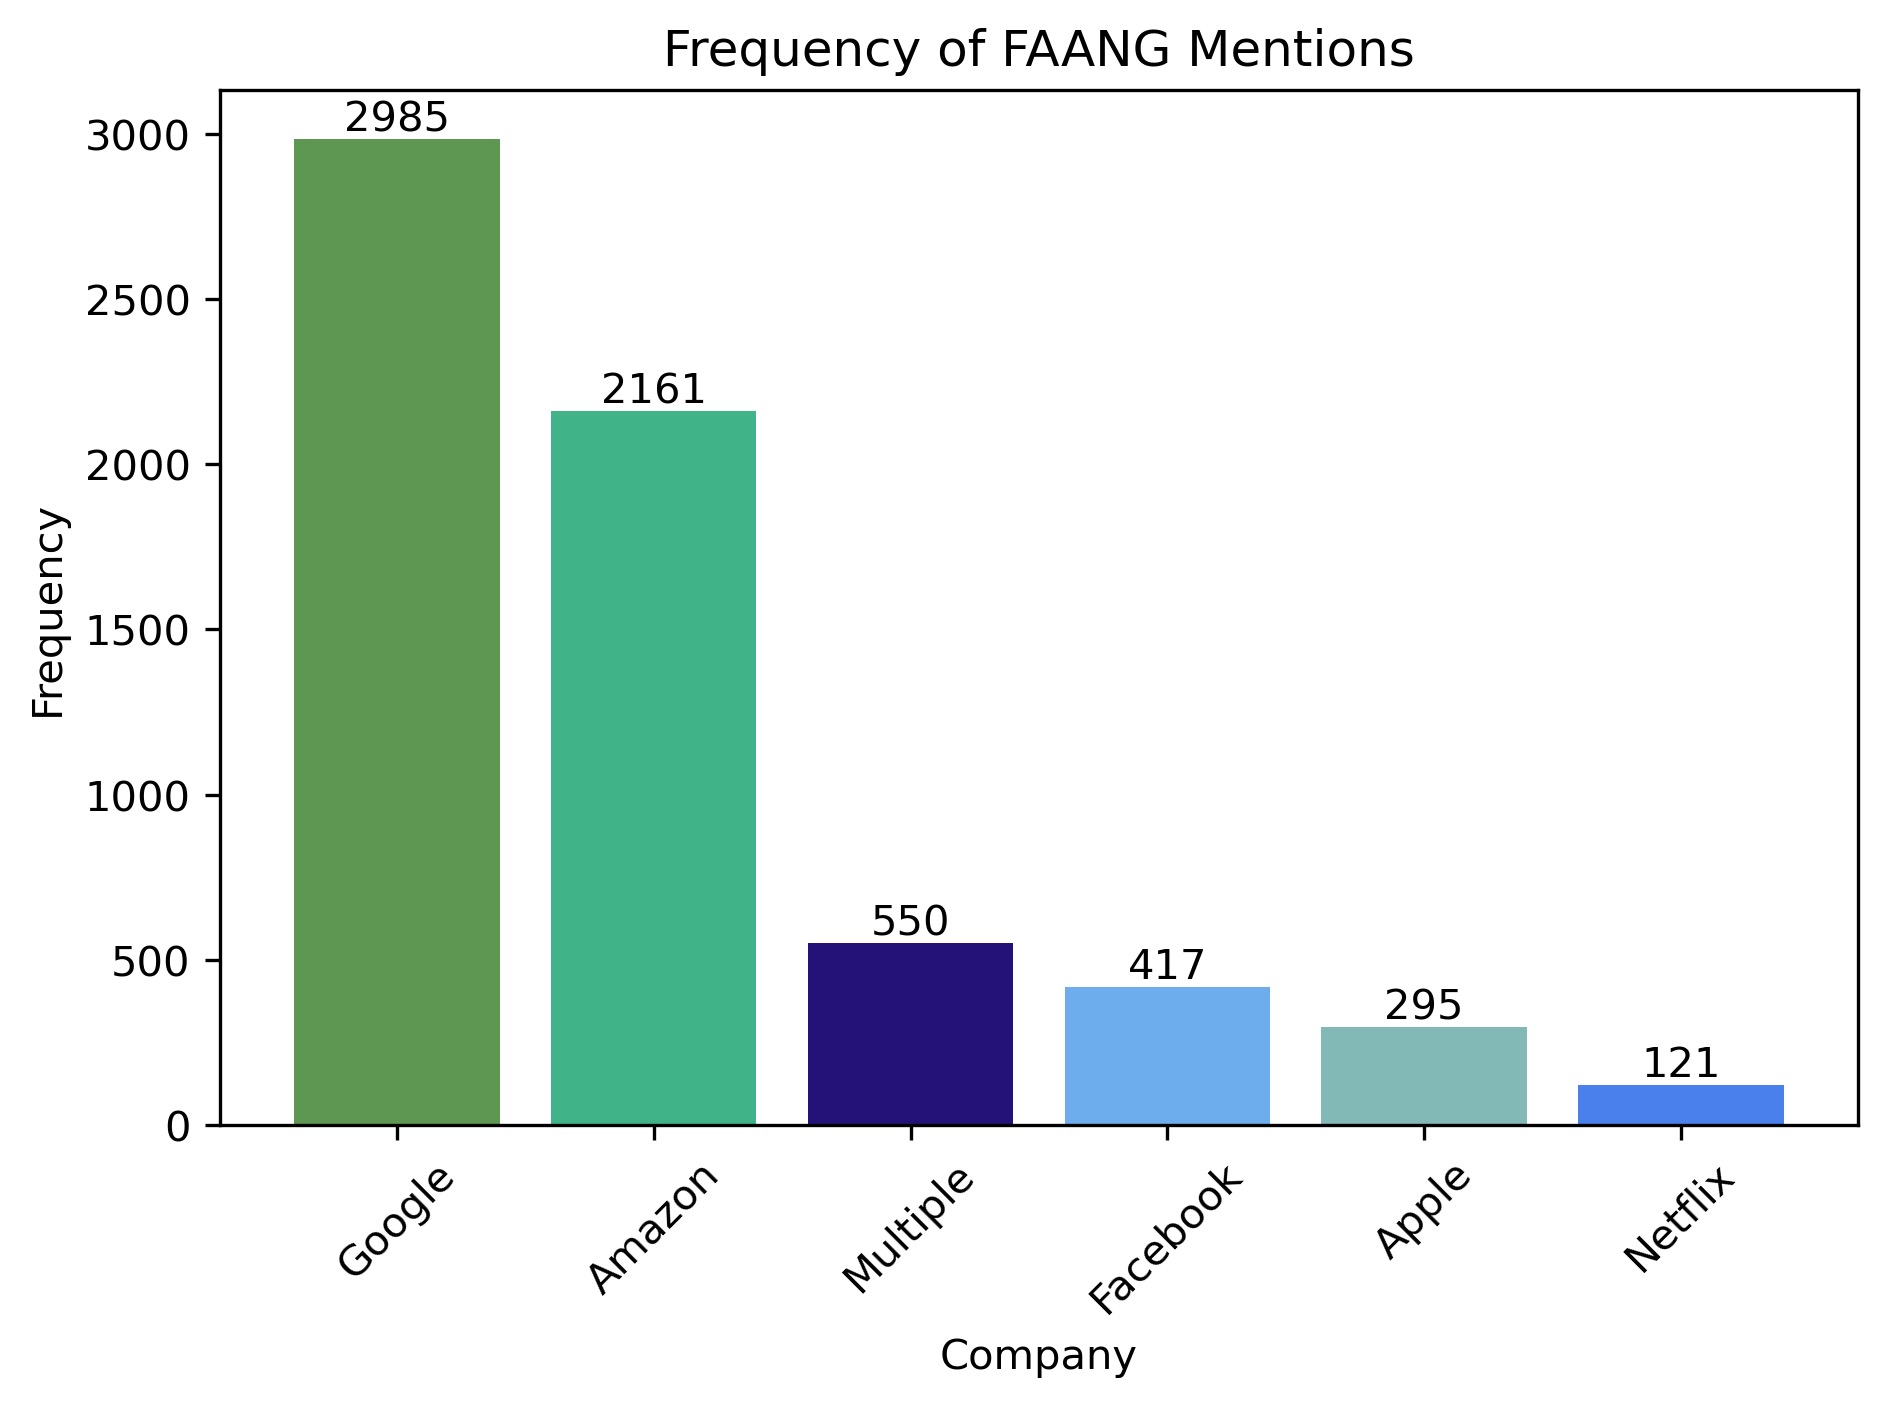 --><imgsrc="images/faang_mentions.png"style="width: 70%; height: auto;"/>The plot below was created using the frequency of FAANG mentions in the Reddit post comments broken down by each company within "FAANG." Comments that included multiple FAANG companies were excluded from this visualization. The external data set (described in more detail at the end of this page) provided the average yearly compensation and base salary information for each of the 5 companies once it was filtered and cleaned. For more information on the cleaning process of the external data set, please see the last section on this page.There are many interesting takeaways from the plot. First, it is clear that there is not a direct association between the frequency that a company is mentioned in the selection of Reddit comments and the average compensation and average base salary at that company. Netflix is hardly mentioned; Netflix's average yearly compensation and average base salary is higher than the rest of the FAANG companies according to the additional data set. Interestingly, the two companies mentioned the most in the Reddit comments (Google and Amazon) do not have the highest compensation metrics. Of course, this is only a subset of Reddit comments and the compensation metrics are based off an external data set, so these takeaways should be used with caution.**NOTE:** The compensation and base salary averages were calculated using data from 2017 to 2021 for each of these companies.```{python}#| eval: False# Plot 5# Filter out comments with multiple FAANG mentions - just get the ones that specifically mention 1 FAANGfrom pyspark.sql.functions import col, when, litdf_one_faang = df.filter(col("Multiple") ==False)# Check new row countdf_one_faang.count()# Prep for merge with external by making a company columndf_one_faang = df_one_faang.withColumn("company", when(col("Facebook") ==True, lit("Facebook")) .when(col("Apple") ==True, lit("Apple")) .when(col("Amazon") ==True, lit("Amazon")) .when(col("Google") ==True, lit("Google")) .when(col("Netflix") ==True, lit("Netflix")) .otherwise(lit("Other")))# Convert to pandas since small, dont need sparkjosh_df_pandas = df_one_faang.select("link_id", "body", "company").toPandas()# Read in the external data setall_salary_info = pd.read_csv("../data/external_data/all_company_salary_info_CLEAN.csv")faang_salary_info = pd.read_csv("../data/external_data/faang_salary_info_CLEAN.csv")# Drop index columnfaang_salary_info = faang_salary_info.drop(["Unnamed: 0"], axis =1)# Round float valuesfaang_salary_info = faang_salary_info.apply(lambda x: round(x, 2) if x.dtype =='float64'else x)# Average tech and non-tech datafaang_df = faang_salary_info.groupby(["company"]).agg({"average_yearly_compensation": "mean", "average_years_experience": "mean","average_years_at_company": "mean", "average_base_salary": "mean","average_stock_grant_value": "mean", "average_bonus": "mean"}).reset_index()merged_df = josh_df_pandas.merge(faang_df, on ="company", how ="left")company_counts = merged_df["company"].value_counts()average_compensation = merged_df.groupby("company")["average_yearly_compensation"].mean()average_base = merged_df.groupby("company")["average_base_salary"].mean()average_experience = merged_df.groupby("company")["average_years_experience"].mean()average_stock_grant = merged_df.groupby("company")["average_stock_grant_value"].mean()fig, ax1 = plt.subplots(figsize = (10, 6))ax2 = ax1.twinx()# Set the bar width and positionsbar_width =0.2x = np.arange(len(company_counts.index))ax1.bar(x - bar_width/3*2, company_counts, bar_width, label='Mention Frequency', alpha=1, color='#5164A1')ax2.bar(x + bar_width/3, average_compensation, bar_width, label='Average Yearly Compensation', alpha=1, color='#82B8B5')ax2.bar(x + bar_width/3*4, average_base, bar_width, label='Average Base Salary', alpha=1, color='#5E9751')# Set labelsax1.set_xticks(x)ax1.set_xticklabels(company_counts.index, rotation=0)ax1.set_ylabel('Mention Frequency', color='black')ax2.set_ylabel('Average Yearly Compensation/Average Base Salary', color='black')# Combine legend and put outside of plotlines, labels = ax1.get_legend_handles_labels()lines2, labels2 = ax2.get_legend_handles_labels()ax1.legend(lines + lines2, labels + labels2, loc='upper left', bbox_to_anchor=(0.27, 1))# Set title and footerplt.title('Mention Frequency vs. Average Yearly Compensation and Base Salary by FAANG Company')plt.figtext(0.1, 0.01, 'Note: Comments and submissions mentioning multiple FAANG companies were not included.', fontsize=10, color='black')# Save figureplt.savefig('../data/imgs/faang_salary_breakdown.png', dpi =300)plt.show()```<!-- 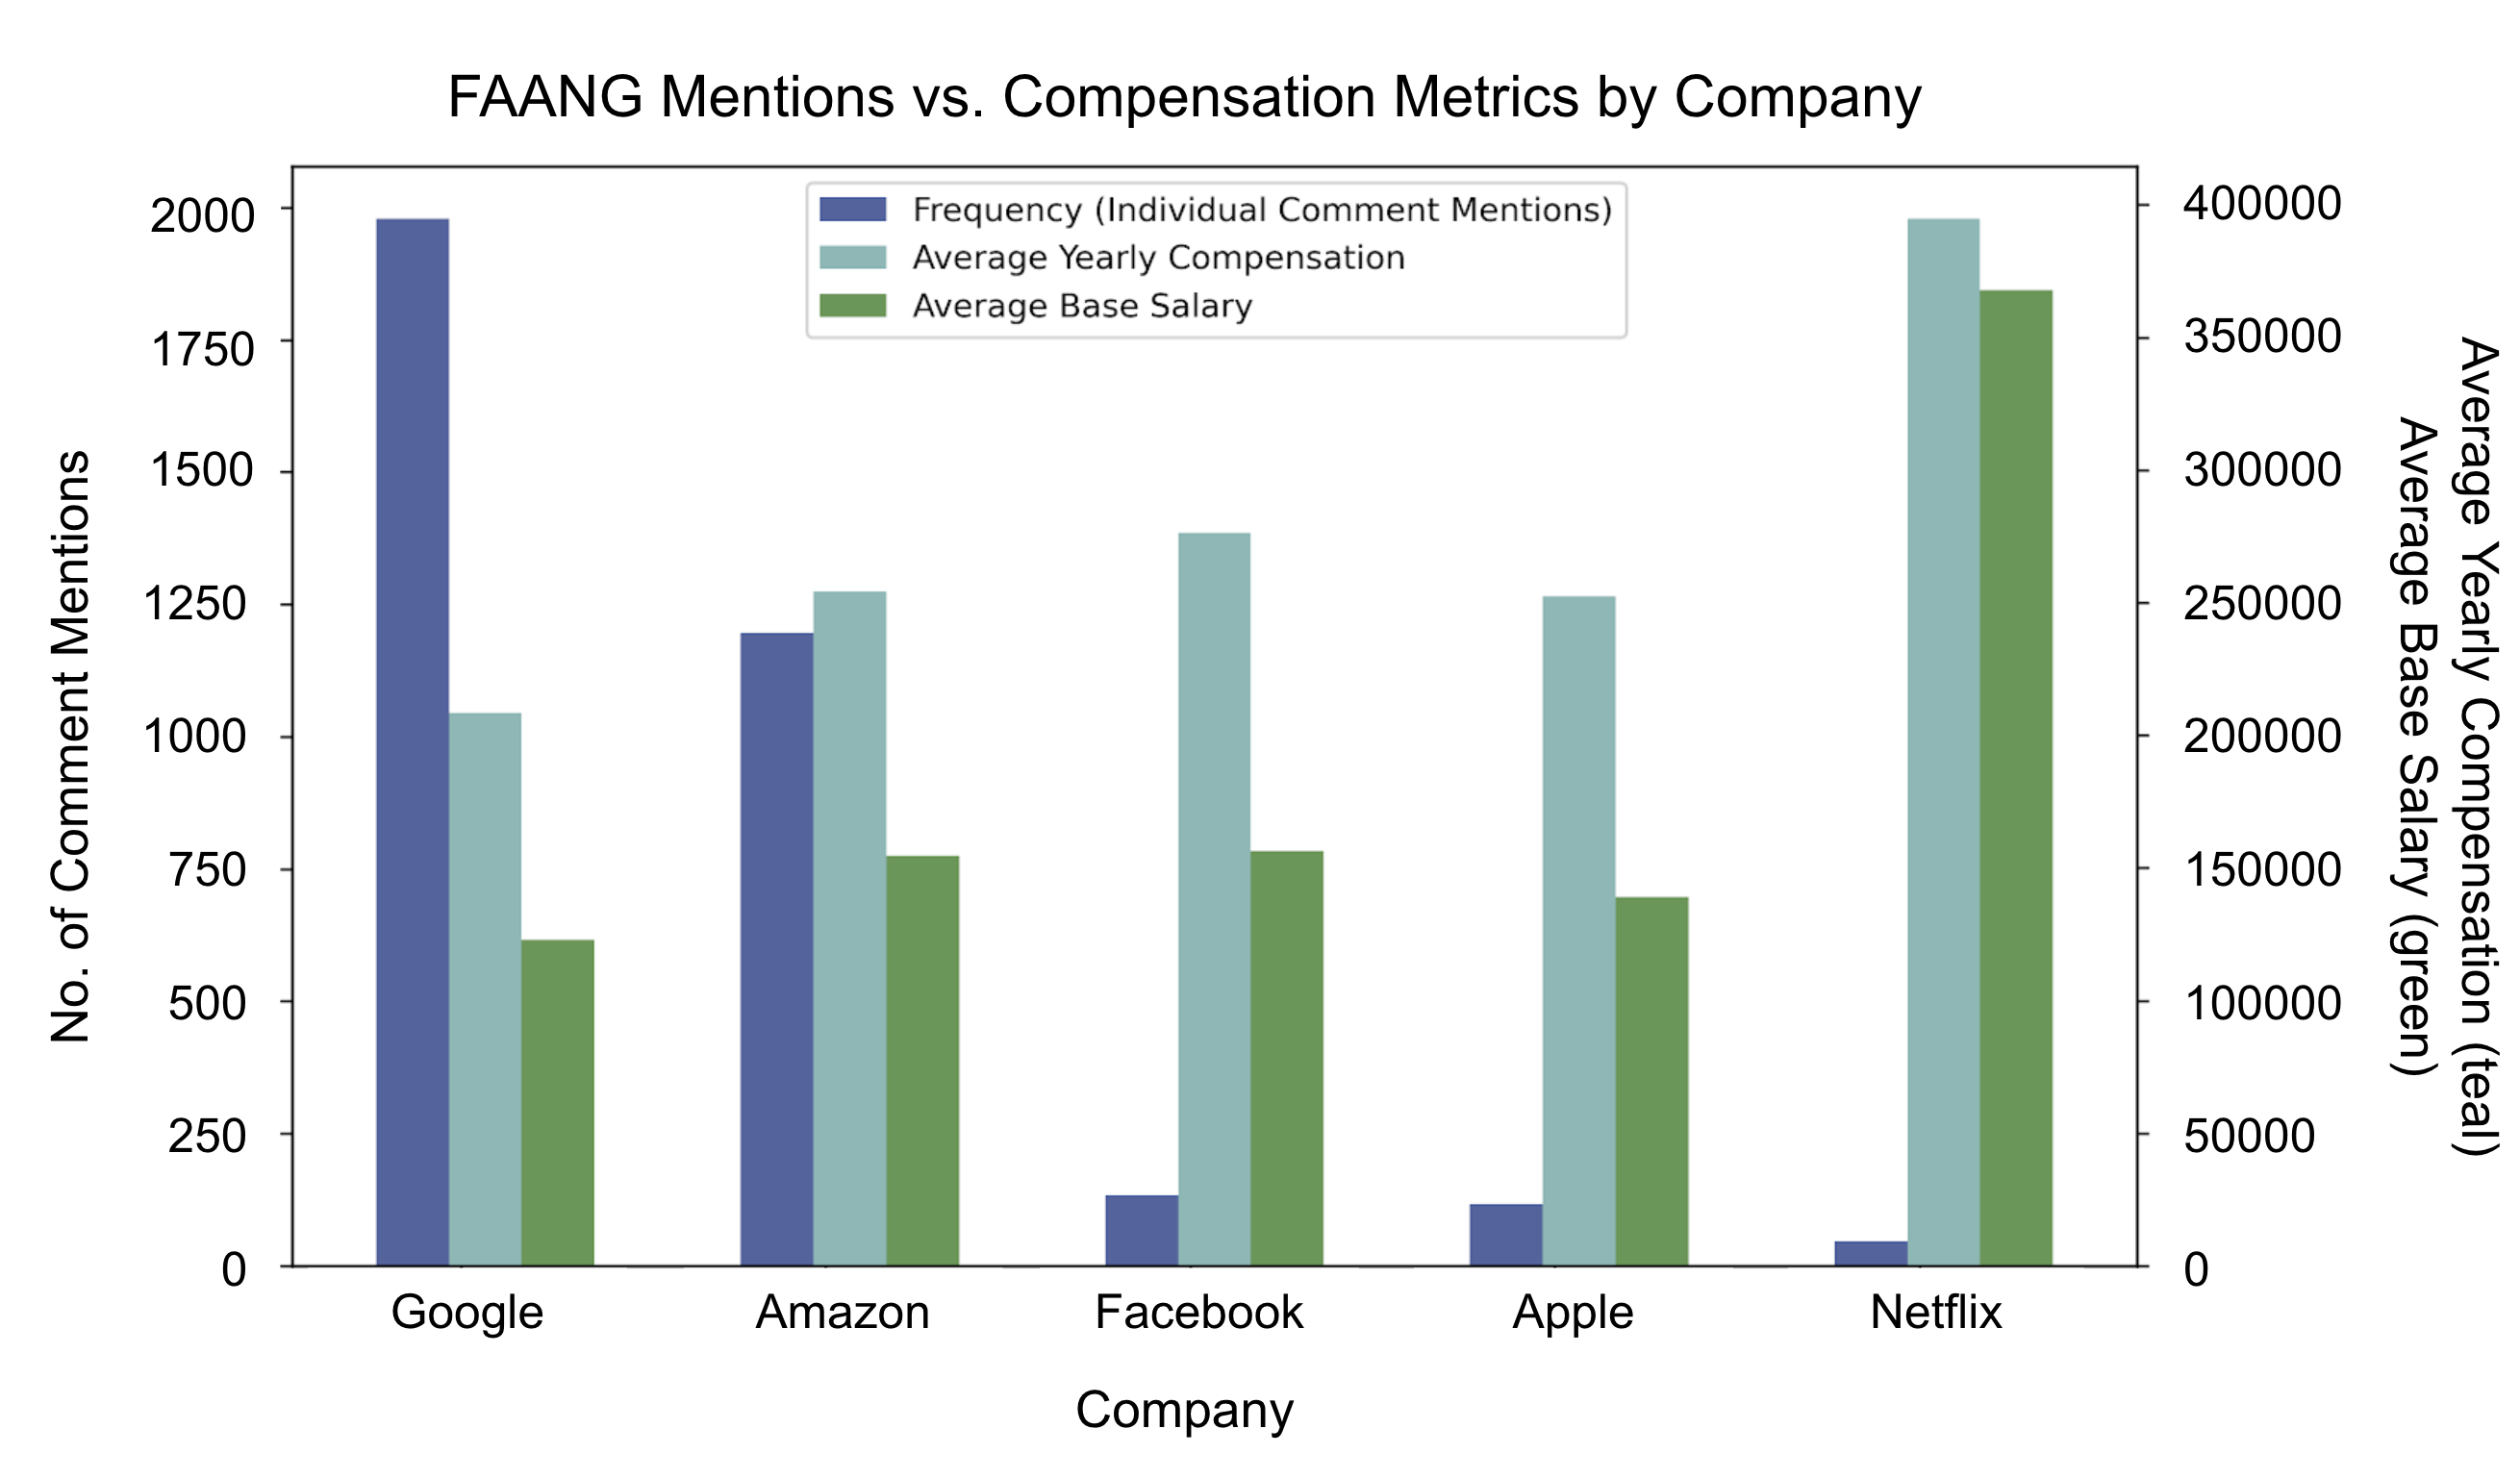 --><imgsrc="images/faang_salary_breakdown.png"style="width: 80%; height: auto;"/>