ML
Executive Summary
The ML (Machine Learning) section delves into applying various machine learning models to predict certain aspects of Reddit posts. First, for submissions, we wanted to see if there were certain characteristics that indicated the score that a post would get. In order to do so, we employed regression models, such as Linear Regression and Random Forest Regressor, for determining the score of submissions. Second, we wanted to determine what aspects of reddit users’ comments resulted in it being flagged as controversial. We used classification models, such as Logistic Regression, Gradient Boosting Trees, and Random Forest, to predict the controversiality indicator of comments. Lastly, as an exploratory excercise, we implemented KMeans clustering on the word embeddings of the submissions to gauge whether subreddits can be segmented based on content. These models were chosen for their suitability in addressing three distinct types of problems:
- Regression for quantitatively predicting a post’s score, and
- Classification for determining the binary outcome of a post’s controversial nature.
- Clustering for understanding whether subreddits submissions can be segmented based on content and other features.
Throughout the analysis, we faced challenges like class imbalances in our features and response. We created multiple models for the regression task, by including and excluding predictors, and found that the Linear Regression model with all predictors performed best. Yet, the best regression model still could explain only 43% of the variability in the response, score. Classification, on the other hand, yielded better results with the highest accuracy, 84%, outputted by the Random Forest Classifier. For Clustering, we had to reduce the dimensionality of the feature set using Principal Component Analysis (PCA), given that the Word2Vec model returned thousands of columns. These results provided valuable insights into the models’ performances and the complex nature of predictive modeling with massive social media data.
Analysis Report
Business Goal #11: Estimate the Expected Score (Number of Up-Votes Minus the Number of Down-Votes) of a Submission Using Provided and Engineered Features.
One of the questions we tried to answer is how accurately we’d be able to predict a submission’s score based on several features. This task dealt with approximately 600,000 rows of submissions. In Reddit nomenclature, a submission’s score refers to the number of upvotes minus the number of downvotes. To answer this question, we test two models: Linear Regression and Random Forest.
The main features being used for this predictive model are the following:
is_video: Whether a submission has a video.spoiler: Whether a submission has spoilers.over_18: Whether a submission has content over 18.title_length: Length of title, which was feature engineered from thetitlecolumn.subreddit: Subreddit to which a post belongs.
Our initial hypothesis was that regression will lead to very poor results, because the response, score is highly skewed (see table and plot below).
| Column | 1% | 25% | 50% | 75% | 99% |
|---|---|---|---|---|---|
| score | 0.0 | 1.0 | 1.0 | 29.0 | 110685.0 |
score
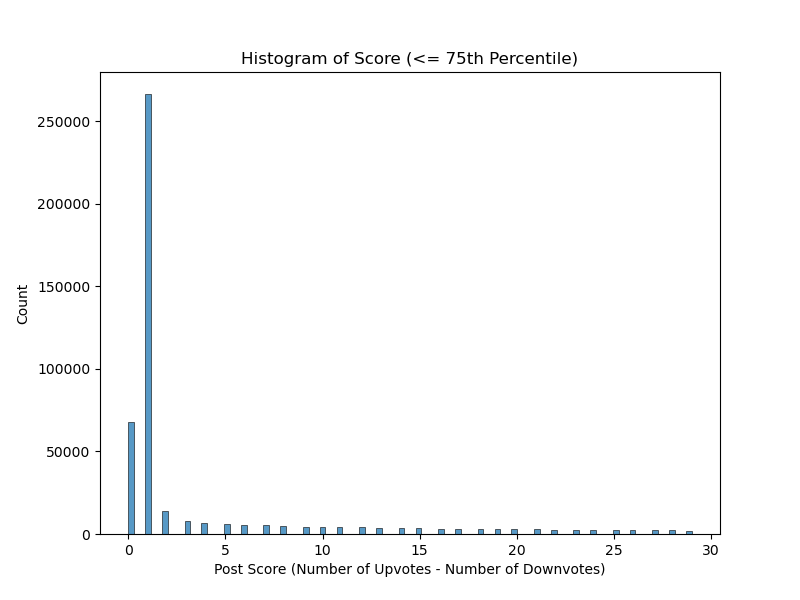
score below 75th Percentile
The primary factor contributing to the poor performance is inherent to the response variable, score. Firstly, a vast majority of scores are centered around 0 and 1 and significantly lower frequencies relative to the maximum score of more than 110,685. Figure 1 above illustrates the distribution of this variable, highlighting its right-skewed distribution. Despite attempts to address this skewness through log transforms, no substantial improvement was observed, as even the transformed data remained skewed.
Model Performance
The two main models used were Linear Regression and Random Forest Regressor. The resulting \(R^2\) values were 0.005 and 0.007 respectively, which reinforced our hypothesis before we ran the models.
Another pivotal reason why the models performed poorly is due to the high class imbalance in three categorical features, is_video, is_spoiler, and over_18. Below is an example of the value counts fot is_spoiler (the other two can be found in the Appendix section):
| is_spoiler | count |
|---|---|
| false | 598,852 |
| true | 1,056 |
is_spoiler
Including Temporal and Other Numeric variables
Initially, we didn’t include time-related features (day, month, year) as well as the features num_comments and gilded, but later incorporated them to explore any temporal effects and user as well as moderator induced behavior on the score. Adding these features significantly increased the model’s performance on the test set! The \(R^2\) values for the Linear Regression and Random Forest models both improved, indicating that time did play a significant role in determining the score of a submission. The test set \(R^2\) values for the Linear Regression and Random Forest models were 0.429 and 0.386 and the test set RMSE values were 402.07 and 417.101 respectively.
The Random Forest model performed slightly worse than the Linear Regression model, which was surprising given that Random Forests are generally more robust to outliers and noise. These metrics are shown in the tables below:
| Evaluation Metric | Value |
|---|---|
| \(R^2\) | 0.429 |
| RMSE | 402.07 |
| Evaluation Metric | Value |
|---|---|
| \(R^2\) | 0.386 |
| RMSE | 417.101 |
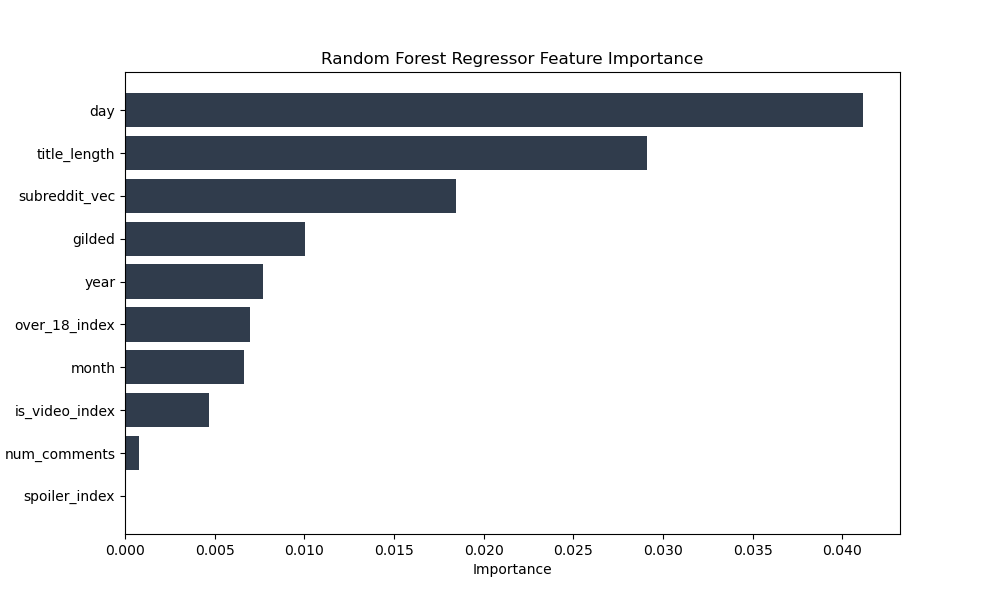
In fact, through the use of the featureImportances attribute of the Random Forest model, we were able to determine that the most important features were gilded, day, title_length, subreddit_vec, and year. This is shown in the plot below:
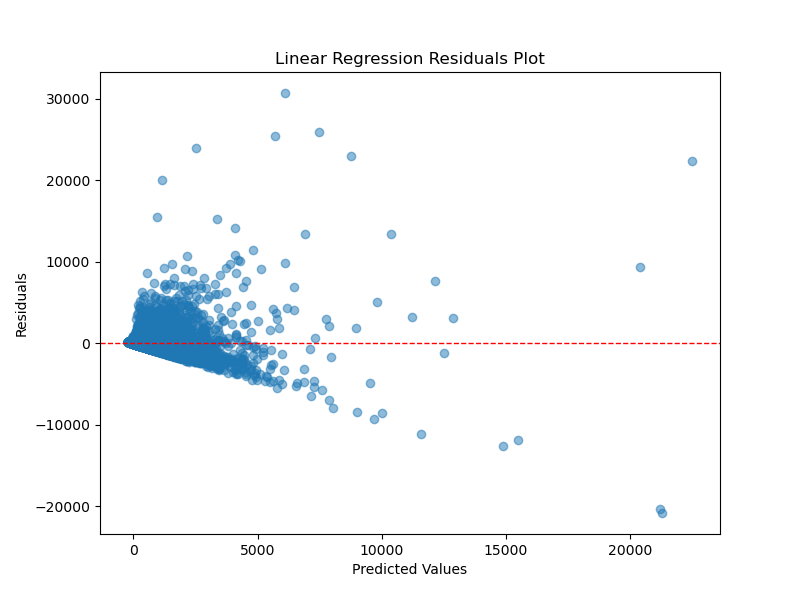
We also plotted the residuals of both regression models to see if there were any patterns in the errors. The plots below shows that a decent amount of the errors are centered around 0, which is a good sign. However, there are some outliers that are worth investigating further. Specifically, from Linear Regression’s residual plot, we see that its predicted values are much higher than the predicted values of the Random Forest model. This is likely due to the fact that Linear Regression is more sensitive to outliers than Random Forests. However, this could also be the reason why Linear Regression performed better than Random Forests because it was able to capture the extreme values of the response variable.

To improve the performance of Random Forest Regressor, we could conduct grid search hyper-parameter tuning. We did try increasing numTrees from 30 to 100 and found that the \(R^2\) value increased to 0.39, by 1%. However, this is not a significant improvement and we believe that the Random Forest Regressor is overfitting the data.
Business Goal #12: Predict the Controversiality of a Comment Using Provided and Engineered Features.
Alongside submissions analysis, we wanted to look into the truly interactive element of Reddit – the comments section. Much like the scores on submissions, comments also have a score that refers to the number of upvotes minus the number of downvotes. However, the controverisality marker is a binary indicator regarding these upvotes and downvotes. According to this Reddit post, controversiality is determined based on both interactions and the balance of these interactions. In other words, a comment needs to have sufficiently large number of upvotes and downvotes, as well as having a balance of upvotes and downvotes (which would result in a score close to 0).
To prepare the comments for analysis, further pre-processing was conducted, such as excluding comments that have been removed or deleted and separating our the created_utc column into individual years, months, and days. Most importantly, since controversiality is a severly imbalanced target variable (approximately 93% non-controversial and 7% controversial), we added a weight column for controversiality to balance class weights and ensure our models pay more attention to controversial comments by up-weighting its importance during training.
We created a Pipeline with the following steps:
StringIndexer(): Converts the columnscontroversiality,distinguished, andsubredditinto numerical representations.VectorAssembler(): Combines the feature columnsdistinguished_ix,subreddit_ix,year,month,day,score, andgildedinto a singlefeaturescolumn.pipeline_model: Represents the ML model being used in the pipeline. Changes based on the argument passed into the Spark Processing Job. Possible options are Random Forests, Logistic Regression, and Gradient Boosted Trees.IndexToString(): Converts the numeric predictions from the model back to the original binary indicators ofcontroversiality.
Classification Results
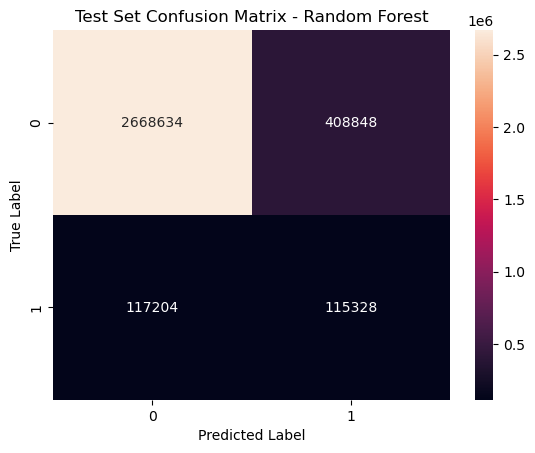
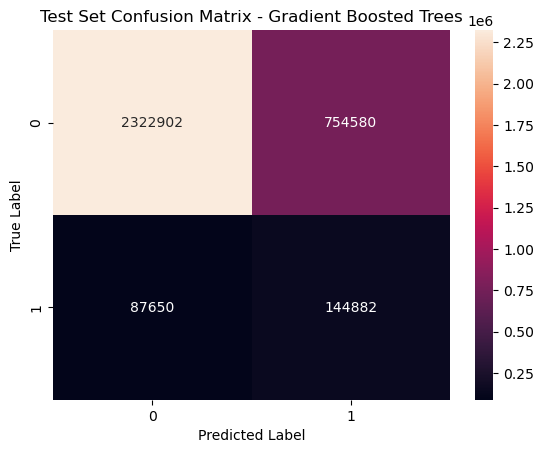
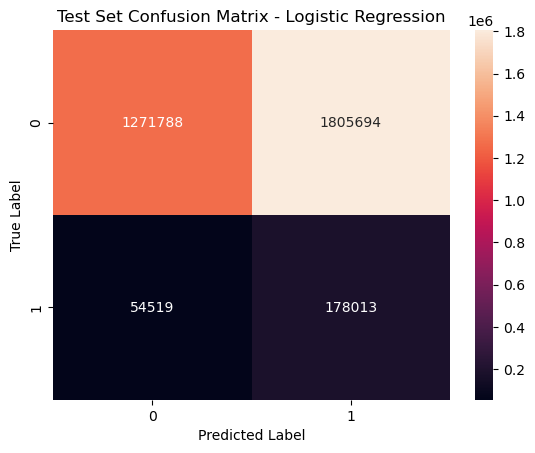
The three models fit were Random Forest, Logistic Regression, and Gradient Boosting. The confusion matrices for each of the models are in the appendix section below, but here is a summary of the findings:
Random Forest: The Random Forest model performed the best out of the three models. It had the highest accuracy, precision, recall, and F1-score. However, it has the lowest number of True Positives, which is not ideal given that we want to be able to predict controversial comments, and comprises on performance by classifying the highest number of True Negatives, cases where the actual label is non-controversial and the model predicts that, and classifying the fewest False Negatives, cases where the actual label is controversial and the model fails to predicts that, than the other algorithms.
Logistic Regression: The Logistic Regression model performed the worst out of the three models. It had the lowest accuracy, precision, recall, and F1-score. However, opposite to Random Forest, it has the highest number of True Positives, which is ideal given that we want to be able to predict controversial comments. Yet, it classifies the highest number of False Negatives, cases where the actual label is controversial and the model fails to predicts that, than the other algorithms.
Gradient Boosted Trees: The Gradient Boosted Trees model performed in the middle out of the three models. It had the second highest accuracy, precision, recall, and F1-score. It has the second highest number of True Positives, which is ideal given that we want to be able to predict controversial comments. Yet, it classifies the second highest number of False Negatives, cases where the actual label is controversial and the model fails to predicts that, than the other algorithms.
The AUC-ROC curve of each of the models can be found below:
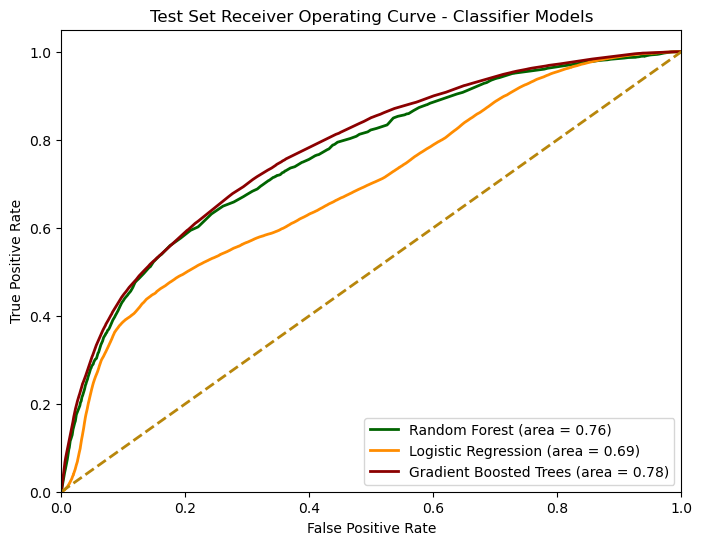
Given that the dataset is heavily imbalanced, we believe the AUC-ROC plot is a better measure of a model’s ability to distinguish between controversial and non-controversial comments. When looking solely at the figure above, Gradient Boosted Trees performs best (albeit marginally), followed by Random Forests, and lastly Logistic Regression.
When accounting for the evaluation metrics, confusion matrices, and the AUC-ROC plot, Random Forests seems to perform the best overall, followed by Gradient Boosted Trees, and lastly Logistic Regression.
Business Goal #13: Determine Subreddit Classification Based on Word Embeddings of Submission Body and Additional Features.
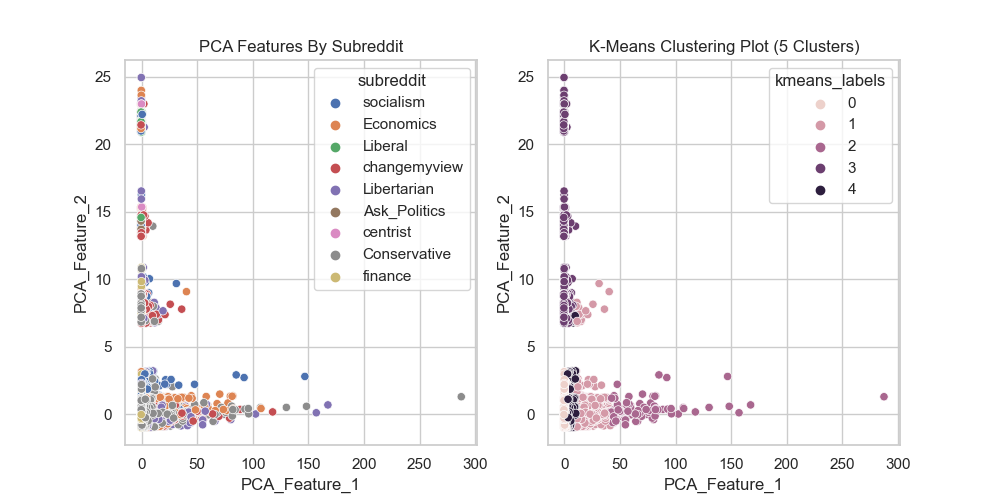
The final task we wanted to tackle was to determine what subreddit a submission belongs to based on the submission body and other features. This task also dealt with approximately 600,000 rows of submissions. In order to do so, we employed clustering models, such as K-Means, for determining the subreddit of a submission. The features used for this unsupervised model are the following: day, month, year, distinguished, score, gilded, num_comments, score, over_18, is_spoiler, and is_video. Apart from these features, we also used the word embeddings of the submission body, which were generated using the Word2Vec algorithm. Once all the features were combined, we used VectorAssembler to combine them into a single features column, scaled the features using StandardScaler, and then reduced the dimensionality of the features using PCA to obtain two principal components.
The figure below showcases the elbow method, which was one of the ways to determine the optimal number of clusters.
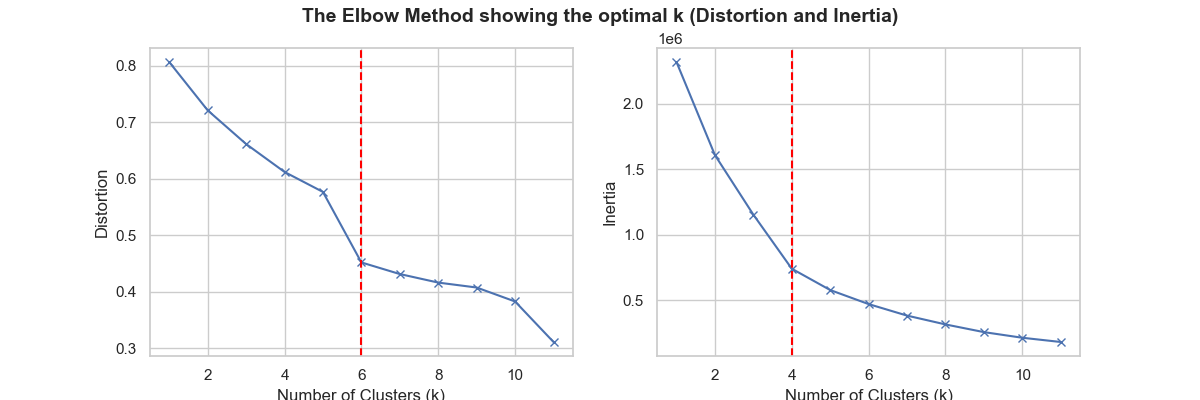
The optimal number of clusters was determined to be four based on distortion and six based on inertia. Therefore, we decided to go with five clusters as a compromise between the two methods:
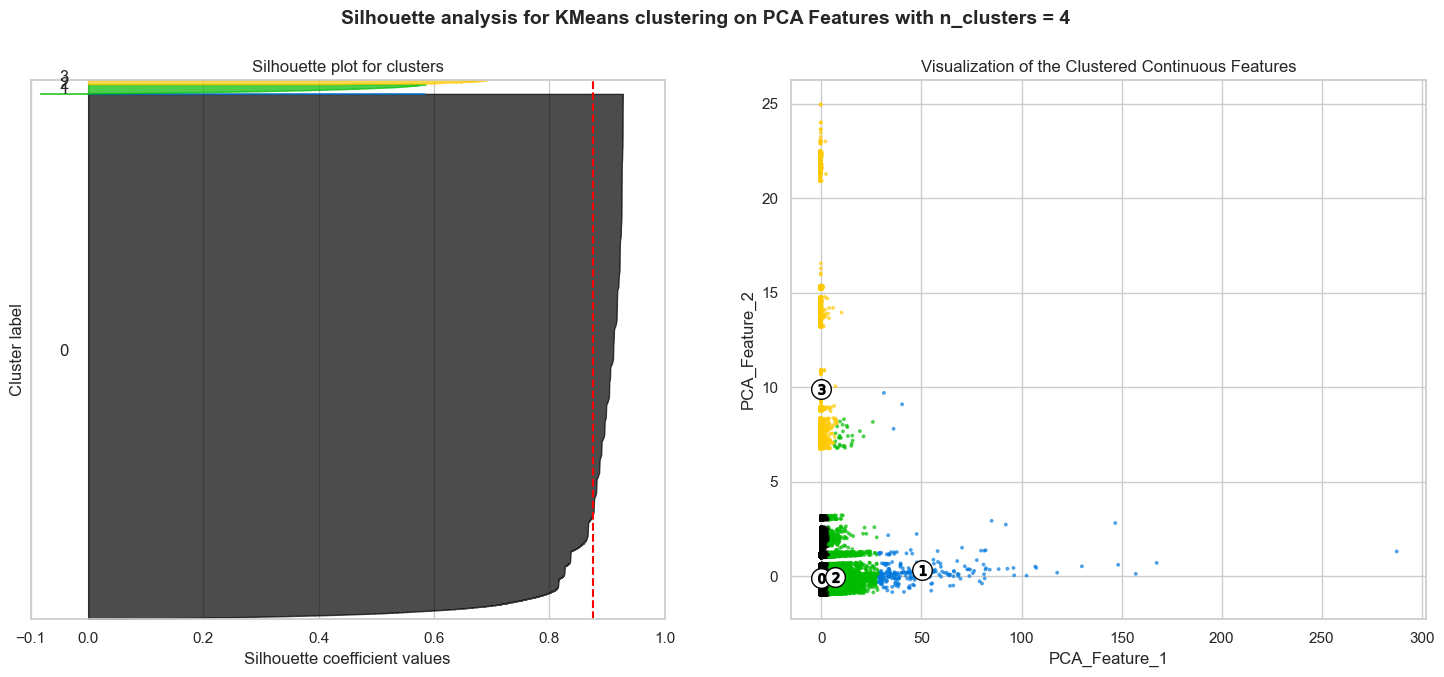
Not satisfied with the elbow method, we also decided to use the silhouette score to determine the optimal number of clusters. The silhouette score is a measure of how similar an object is to its own cluster compared to other clusters. The score ranges from -1 to 1, where a score of 1 indicates that the object is far away from its neighboring cluster and very close to the cluster it is assigned to. The higher the score for a cluster, the more distinct and well-separated the clusters are. In contrast, a score close to -1 suggests overlapping clusters, indicating that the object could be assigned to a neighboring cluster. The figure below shows the silhouette score for different number of clusters:
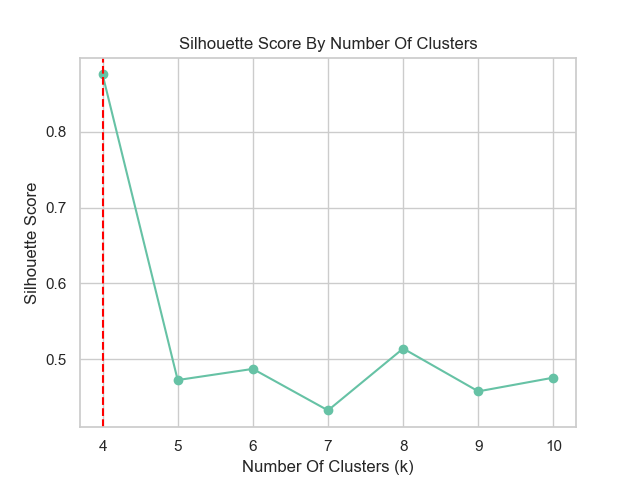
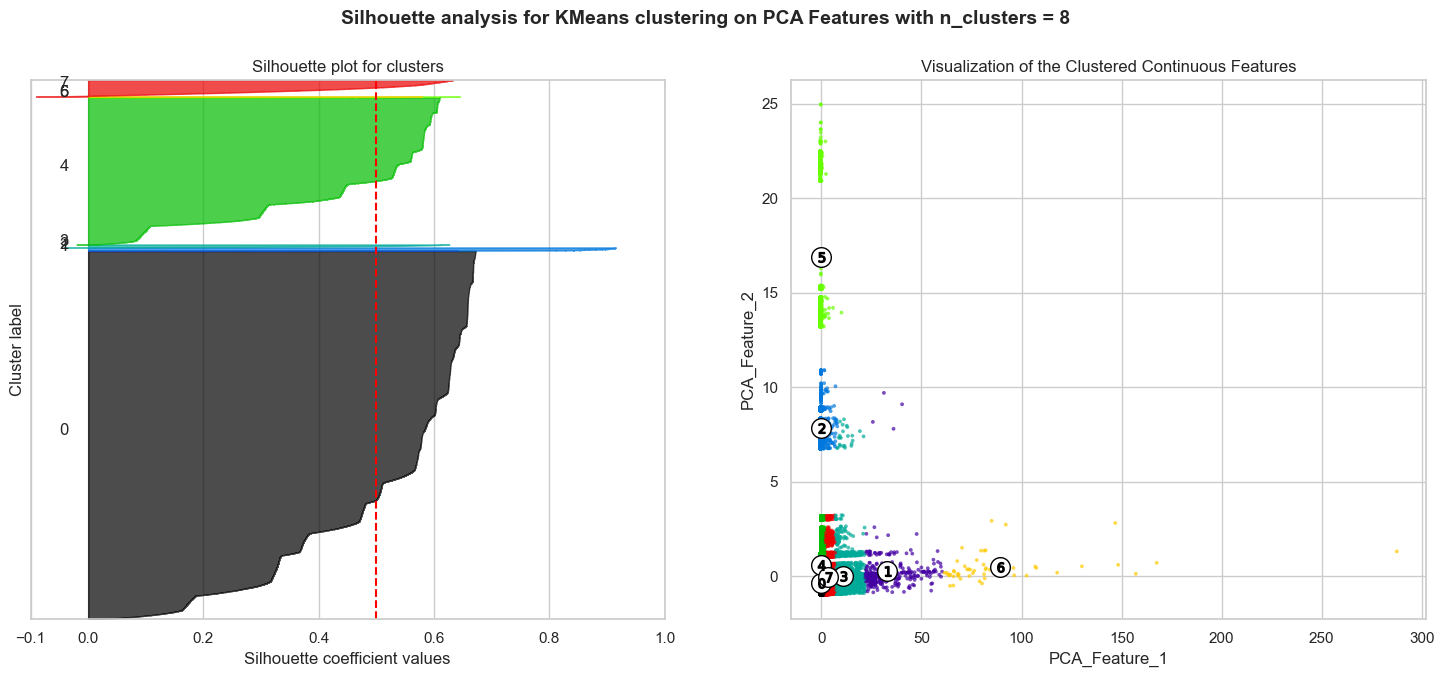
We see that the silhouette score is highest for four clusters, which is in line with the elbow method. In fact, the highest silhouette score is 0.91, corresponding to two clusters. This reconciles well with the types of subreddits we are analyzing, which are either political or economics related. The silhouette plot below coupled with the scatter plot on the right shows the clusters for nine clusters:
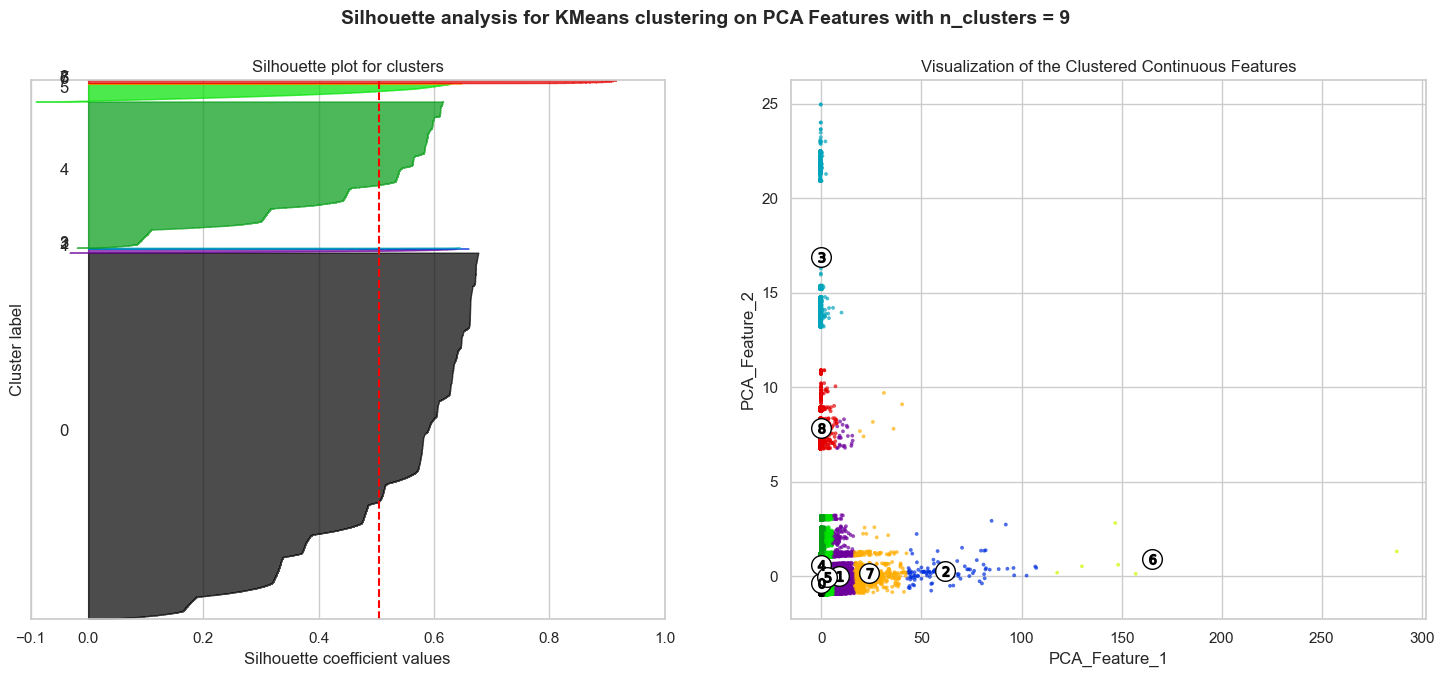
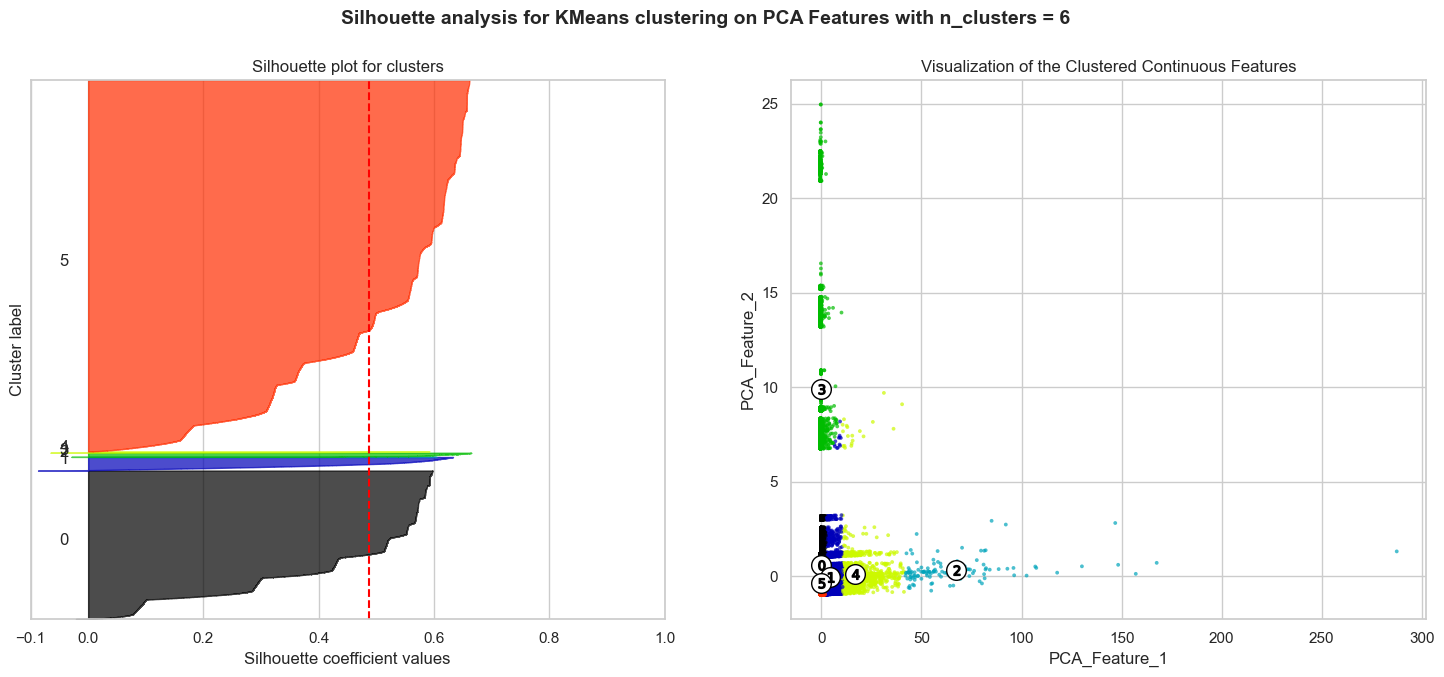
Silhouette plots look to have an edge over the elbow method as one can evaluate clusters on multiple criteria, including scores below average Silhouette score (red vertical line), wide fluctuations in the size of the plot, and non-uniform thickness. Therefore, it is highly likely that one can end up determining the most optimal number of clusters in K-means using the above plots.
Most clusters have scores above the average Silhouette score (red vertical line) and the thickness of the silhouette plots suggests that the cluster sizes are highly different or non-uniform. Our aim is to choose those n_clusters that correspond to uniform thickness of the clusters’ Silhouette plot. In the appendix below, for n_clusters=4, the silhouette score is lower than that of n_clusters=9, but the thickness of the silhouette plots is still non-uniform. Unfortunately, we have no n_clusters value that showcases that all the clusters are more or less of similar thickness and, hence, are of similar sizes as can also be verified from the labelled scatter plot on the right. Therefore, we decided to go with two clusters, given that it has the highest silhouette score and the clusters are of similar thickness, as can be seen from the silhouette plot below:
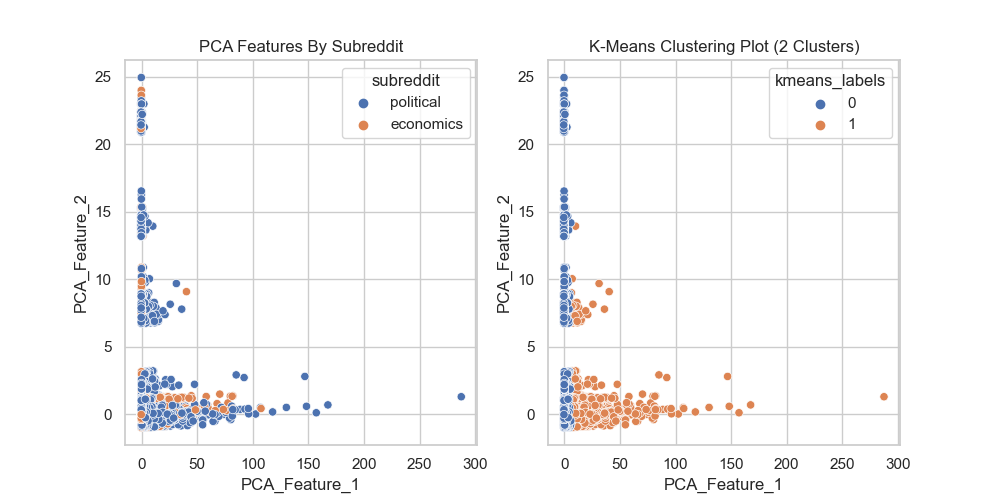
In conclusion, given the complexity of the data, we believe that the K-Means clustering algorithm did not perform well. The sheer number of overlap in principal components between the political and economics subreddits made it difficult for the algorithm to cluster the data. In addition, the fact that the data is highly imbalanced also made it difficult for the algorithm to cluster the data. In the future, we would like to explore other clustering algorithms, such as DBSCAN, to see if we can get better results.
Appendix
| over_18 | count |
|---|---|
| false | 595,936 |
| true | 3,972 |
over_18
| is_video | count |
|---|---|
| false | 596876 |
| true | 3032 |
is_video
| Evaluation Metric | Value |
|---|---|
| Test Accuracy | 0.841 |
| Test Error | 0.159 |
| Precision | 0.958 |
| Recall | 0.867 |
| F1-score | 0.868 |
| Evaluation Metric | Value |
|---|---|
| Test Accuracy | 0.667 |
| Test Error | 0.333 |
| Precision | 0.971 |
| Recall | 0.662 |
| F1-score | 0.749 |
| Evaluation Metric | Value |
|---|---|
| Test Accuracy | 0.451 |
| Test Error | 0.549 |
| Precision | 0.960 |
| Recall | 0.427 |
| F1-score | 0.561 |