Exploratory Data Analysis
Analysis Report
In this analysis, we used Submissions Reddit data stored in an Azure Machine Learning workspace blob store in parquet format, employing PySpark for distributed data processing and Pandas for local data manipulation and analysis.
To kick off our exploration of entertainment subreddits, we aimed for a broad understanding of how submissions are distributed across entertainment-related subreddits. To achieve this goal, we created a lollipop graph with post counts of subreddits on the x-axis and different entertainment subreddits on the y-axis.
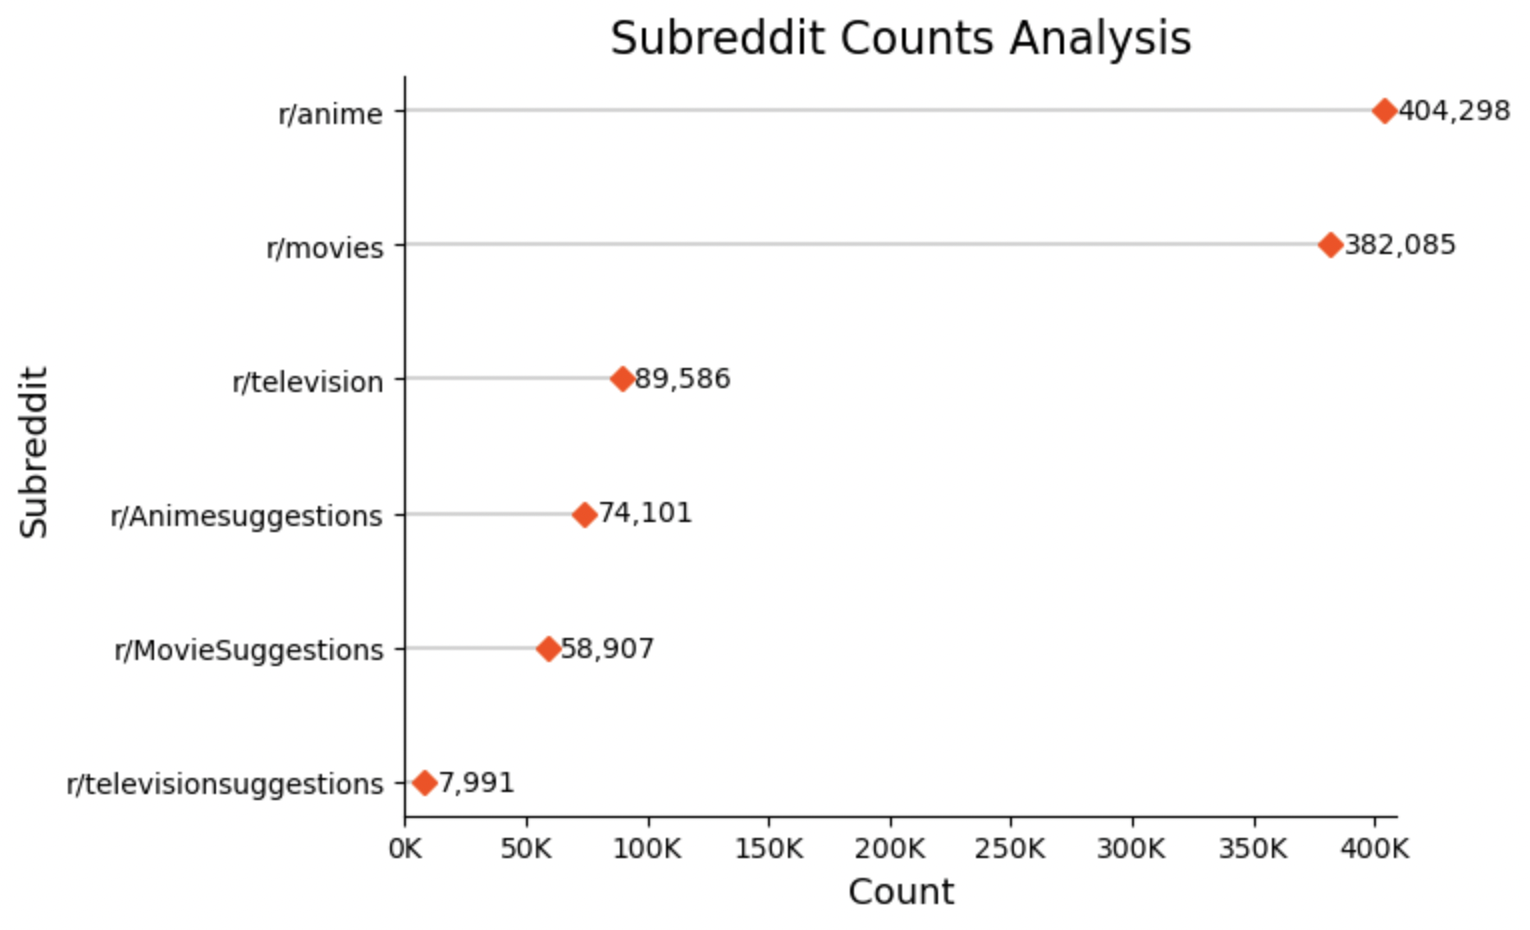
From Figure 1, it’s evident that the ‘anime’ subreddit is the most active with 404,298 posts, showcasing a very active community with a strong interest in anime-related content. Following closely is the ‘movies’ subreddit, with activity at 382,085 posts. Both ‘anime’ and ‘movie’ subreddits outshine the ‘television’ subreddit in post counts, revealing higher user engagement in these topics. A similar trend can be observed among the subreddits dedicated to suggestions with the ‘AnimeSuggestions’ subreddit having a higher post count followed by ‘MovieSuggestions’ and ‘televisionsuggestions’. This indicates that there is a substantial interest in recommendations for anime. The ‘MovieSuggestions’ subreddit has a moderate number of posts, while ‘televisionsuggestions’ has the least, reflecting lower user engagement for television recommendations on the Reddit platform.
Next, we filtered the data to keep only the subset of columns relevant to our analysis. The selected columns include information about the submission, such as the subreddit, author, title, selftext, creation timestamp, number of comments, score, and various other attributes related to the submission’s characteristics. After selecting specific columns, we aimed to understand the dataset’s structure and quality. To achieve this, we obtained the count of missing values in each column of the dataset. Table 1 represents a summary of missing values in our dataset, where each row corresponds to a different feature, and the ‘Missing Values’ column quantifies the number of missing values for each feature.
Table-1 shows that columns such as ‘author’, ‘title’, ‘selftext’, ‘created_utc’, ‘num_comments’, ‘score’, ‘over_18’, ‘pinned’, and ‘locked’ show complete data with zero missing values, suggesting they are mandatory fields in the platform’s post submission process. While, a significant number of missing values are observed in the ‘disable_comments’, ‘distinguished’, and ‘media’ columns. This could indicate that these fields are optional or applicable only to certain posts. This makes sense for instance, ‘distinguished’ could denote a special status assigned to certain posts, which would naturally be less common. Since the columns with the missing values were not relevant to our business goals and also removing missing values from these columns could remove posts with optional features. So we decided to retain the rows with missing values and it would also preserve the completeness of the dataset.
Moving further, three new columns were added to the data by transforming the original DataFrame:
- Firstly, we extracted various time-related features like ‘hour_of_day’, ‘day_of_week’, ‘day_of_month’, ‘month’, and ‘year’ from the ‘created_utc’ timestamp. These features can be useful for analyzing trends or patterns in the data based on temporal information.
- Secondly, we wanted to analyze the overall length of posts, so we added a new column ‘post_length’ to the data. The values in this column are calculated based on the sum of the lengths of the ‘title’ and ‘selftext’ columns for each row.
- Thirdly, we created a new column called ‘has_media’ that is set to “True” if a post has media content (like images or videos) and “False” if it doesn’t. This makes it easier to identify which posts include some form of media and which do not.
After these transformations were done, the columns like “media,” “created_utc,” “disable_comments,” and “distinguished,” which were no longer necessary for our analysis, were dropped.
The following table shows the final columns and their descriptions that were used for our analysis.
Moving forward, we performed data manipulation to generate structured datasets encompassing top comments for specific subreddits, author post counts, and time series analysis. These datasets will serve as a foundation for extracting insights into user engagement, content popularity, temporal evolution, and author contributions on the Reddit platform through the creation of meaningful visualizations.
The detailed process and code can be found here for data cleaning and here for data manipulation.
Understanding trends in the engagement of posts from 2021-2023
Next, we were curious to see how the general trend in the engagement across prominent subreddits —‘anime,’ ‘movies,’ and ‘television’ evolve over different periods of time. In order to achieve this we firstly decided to analyse how number of posts and the scores varied over the period of two years.
Figure-2 attempts to capture the trend in the number of posts made across the three subreddits over the time period of 2021-2023. To facilitate a more accurate assessment of relative fluctuations in user engagement and post frequency, normalized post counts were used. Overall, the subreddits exhibit a more gradual decline, implying a slow yet consistent decrease in the number of posts and interactions. The overarching decline across all three subreddits raises questions about the factors influencing these changes.However, when comparing the three sections, we can observe that the movies and anime subreddits show a general decrease in the number of posts. On the other hand, the engagement, in terms of posts made, remains relatively constant for the television subreddit. The possibility of shifting platform dynamics, evolving content consumption patterns, or the rise of alternative entertainment forums could be contributing to this trend. It indicates a potential shift in the digital landscape where traditional subreddit forums may no longer command the same level of attention as before. Certain high peaks could possibly correlate to significant new releases in any of the three categories, resulting in increased engagement and discussions on the platform. For instance, we can see a peak starting from March 2021, which could equate to the release of Zack Snyder’s much-hyped movie, Justice League.”
Figure 3 shows the trends in changes in the average scores from 2021 to 2023. When comparing Figures 2 and 3, we observe that, in general, scores remain relatively constant for the anime section during this period, despite a considerable fluctuating decline in the number of posts. However, for movies and television, there is a general slight upward trend in scores, in contrast to the step downward trend in the number of posts. This suggests that, for these two categories, the number of posts made is slightly inversely proportional to the rating. This could be due to the availability of fewer posts to view, resulting in an increase in scores for those written during that period.
Next, we wanted to see if there are any trends in the number of posts and average score depending on the time of the month. This was to figure out if there was a day of the month were the number of engagement on the platform were showing a particular trend either high or low.
Figure 4 compares the number of posts across the three subreddits by the day of the month. In this figure, it is challenging to pinpoint any specific day of the month where the number of posts is particularly high. The downward trend at the end of the month is attributed to the variation in the number of days each month, as not every month has 31 days.
When examining Figure 5, which compares the average scores for each day of the month, it is apparent that the scores generally remain constant with occasional bumps in all three categories. However, television shows the highest ratings despite having the fewest number of posts. This observation seems to confirm an inverse relationship between the number of posts and the scores. Furthermore, we aimed to streamline our analysis to understand how trends in the number of posts and scores vary when comparing different days of the week and hours of the day.
Figure-6 presents the distribution of posts across days of the week and hours of the day for the subreddits ‘anime,’ ‘movies,’ and ‘television.’ This visualization suggests that the ‘television’ subreddit has its own unique pattern of user interaction, potentially reflecting the airing schedule of popular shows or weekly events that drive discussions, especially during the evening hours from 3 PM to 5 PM. Overall, all three subreddits show a more spread-out activity throughout the week, indicating a consistent level of engagement without significant peaks or troughs.
Figure-7 illustrates the distribution of average scores across days of the week and hours of the day for the subreddits ‘anime,’ ‘movies,’ and ‘television.’ The plot suggests that people are generally more active in reading and voting for posts each day of the week, particularly during the late afternoon hours of 2 PM to 4 PM. This trend is also directly proportional to the number of posts made during those hours.
Overall, we can assert that interaction activities peak on these Reddit threads during the late afternoon hours. These insights underscore the importance of timing in Reddit community engagement. For marketers and content creators, aligning content releases with these observed peaks could enhance user engagement. For platform moderators, it could inform the scheduling of events or AMAs (Ask Me Anything sessions) to ensure higher participation rates. Additionally, this data could assist in the strategic placement of advertisements during specific hours of a particular day, ensuring they reach the most active audience segments.
Exploring how Reddit post engagement dynamics is influenced by subreddit characteristics.
Next, we delved into the diverse aspects of user engagement dynamics on Reddit posts, investigating variations related to characteristics such as score, post length, number of comments, and the inclusion of media content. To do this analysis we have created a bubble plot comparing the post engagement by Length and Score across the three subreddits. Additionally,the posts with media and those without media within the anime, movies, and television subreddits on Reddit are analysed.
Figure 8 illustrates the engagement dynamics of Reddit posts, comparing post length to user engagement across subreddits dedicated to anime, movies, and television. Each dot represents an individual post, with its size corresponding to the score, which is a proxy for the post’s popularity or engagement level.
This analysis reveals a dense clustering of posts with scores under 10,000 across all subreddits, with post lengths predominantly falling below 2000 characters. This suggests that shorter posts are more common, regardless of the subreddit category. Interestingly, there is a visible trend where posts with higher scores tend to have shorter lengths, indicating that more concise posts may resonate better with the audience or are more likely to be engaged with.
The larger-sized dots, indicating posts with exceptionally high scores, are predominantly short and are scattered across all three subreddits. This may indicate that highly engaging posts, which are likely to go viral or hit the front page of Reddit, tend to be concise.
This insight can inform content creators and marketers about optimal post lengths for audience engagement in different entertainment categories on Reddit.
Figure 9 illustrates the engagement dynamics of Reddit posts, comparing post length to user engagement within submissions that have media as well as those that don’t have media. Each dot represents an individual post, with its size corresponding to the score, which is a proxy for the post’s popularity or engagement level.
From Figure 9, it seems that posts with media tend to have a higher score regardless of post length, as indicated by the concentration of orange dots across all lengths, especially in the higher score region. There are some high-scoring posts without media, but these are less frequent as the score increases. This suggests that including media in a post could potentially lead to higher engagement on Reddit.
We further analysed the percentage of posts with and without media across the three subreddits.
From Figure 10 we can see that the percentage of posts with media is significantly higher than those without across all three subreddits. The “movies” subreddit has the highest percentage of posts with media (89.75%), followed by “television” (83.64%), and “anime” (82.56%). Conversely, the percentage of posts without media is the lowest in the “movies” subreddit (10.25%), which correlates with the earlier observation that media content is prevalent in high-engagement posts.
Overall, these three graphs gives us insights about engagement on Reddit which suggest that not only is the presence of media a factor, but so is the length of the post. Content creators could use this information to optimize their posts for better engagement by creating concise posts that include media, and targeting their efforts towards subreddits where these types of posts perform well.